What is the Linux system load ? Can refer this article or this Linux load averages are “system load averages” that show the running thread (task) demand on the system as an average number of running plus waiting threads. R + D state: Running + Uninterruptible Sleep
stress sysstat
We can do some test by command stress
1
2
3
4
5
6
7
8
9
10
11
12
13
apt install stress sysstat

# stress i cpu
stress --cpu 1 --timeout 600

# check uptime load
watch -d uptime

# check ALL cpu status
mpstat -P ALL 5

# check every process or thread cpu usage
pidstat -u 5 1
A thread is the basic unit of scheduling, and the process is the basic unit of resource owners
Thread
smallest sequence of programming instructions that can be managed independently by a scheduler
Has its own register e.g. PC (program counter), SP (stack pointer)
Process
instance of a computer porgram that is being executed
A process can have one or multiple thread
Most programs are single threaded
Parallel computing
Run program currently on one or more CPUs
Multi-threading (shared-memory)
Multi-processing (independent-memory)
context switch
1
2
3
4
5
6
7
8
9
10
# interval 5s output 1 row data $ vmstat 5 procs -----------memory---------- ---swap-- -----io---- -system-- ------cpu----- r b swpd free buff cache si so bi bo in cs us sy id wa st 0 0 0 7005360 91564 818900 0 0 0 0 25 33 0 0 100 0 0
# check all context switch vmstat 1 procs -----------memory---------- ---swap-- -----io---- -system-- ------cpu----- r b swpd free buff cache si so bi bo in cs us sy id wa st 6 0 0 6487428 118240 1292772 0 0 0 0 9019 1398830 16 84 0 0 0 8 0 0 6487428 118240 1292772 0 0 0 0 10191 1392312 16 84 0 0 0
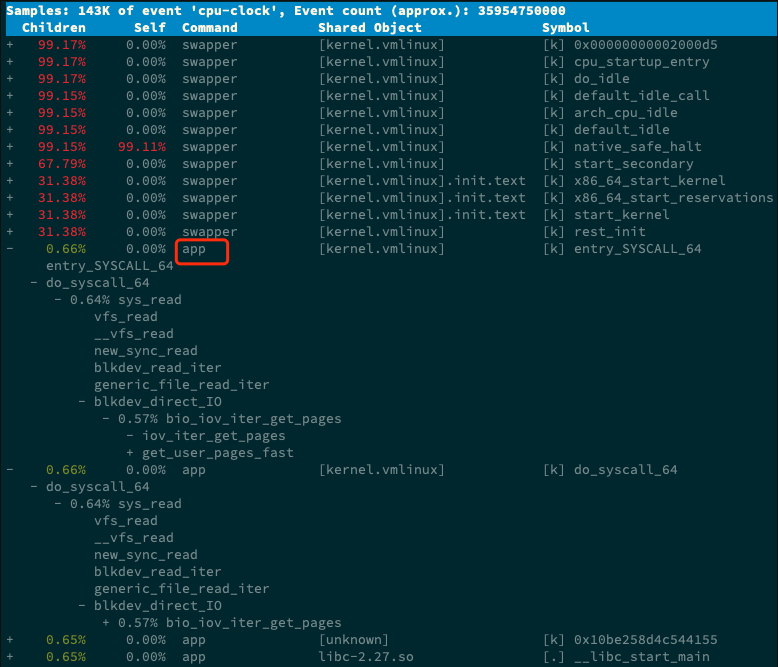
# Best practice how to perf container process # perf record in host then perf report in container # install perf in host apt-get install -y linux-tools-common linux-tools-generic linux-tools-$(uname -r))
Linux divides the interrupt handling process into two phases, the upper half and the lower half: The first part is used to quickly handle interrupts. It runs in interrupt disable mode and mainly deals with hardware-related or time-sensitive tasks. The second part is used to delay processing of the unfinished work in the upper half, usually running as a kernel thread.
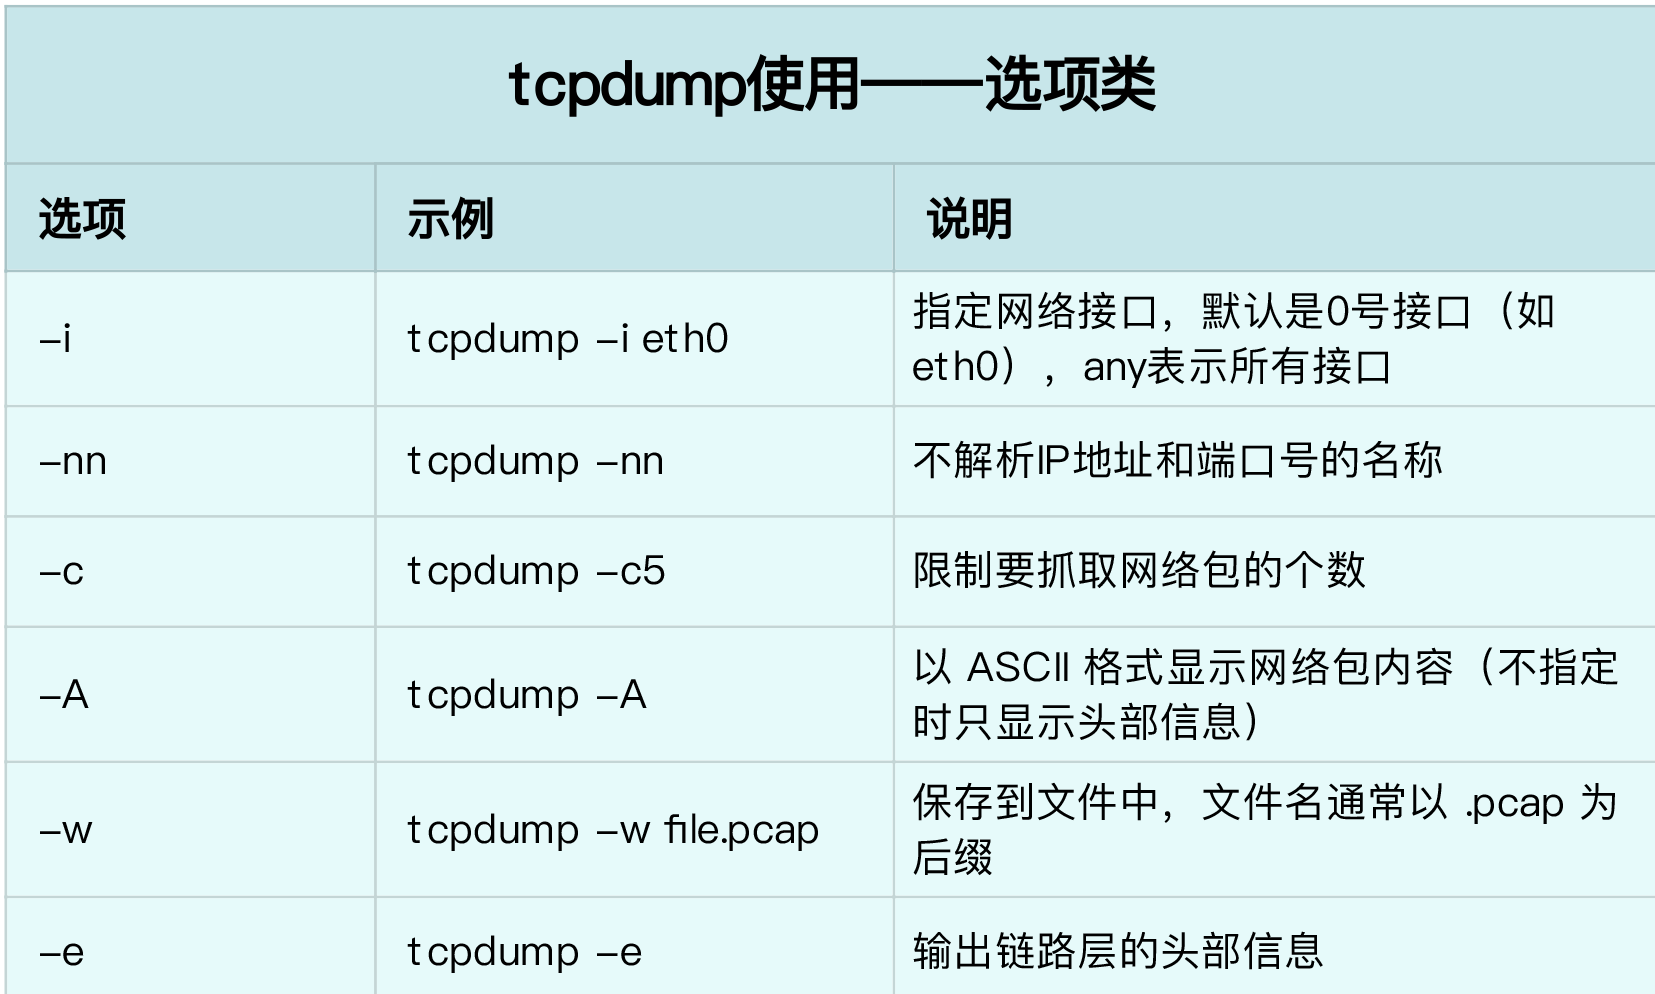
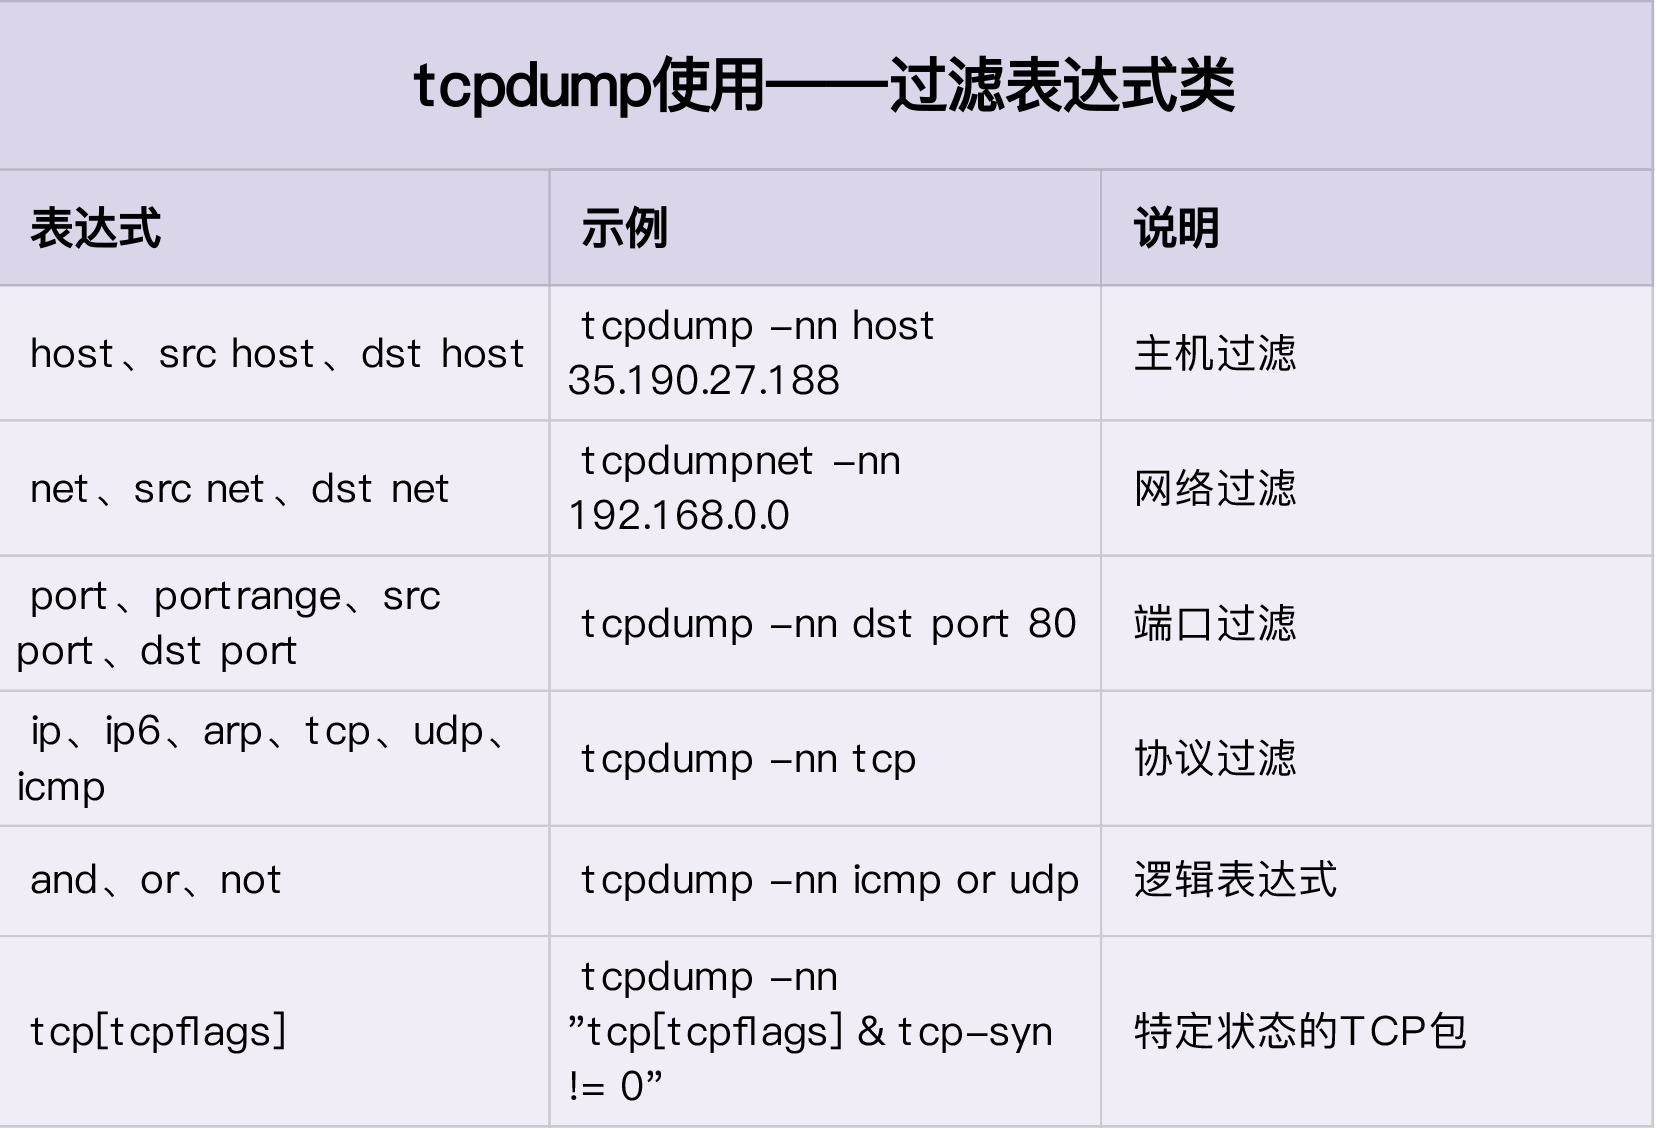
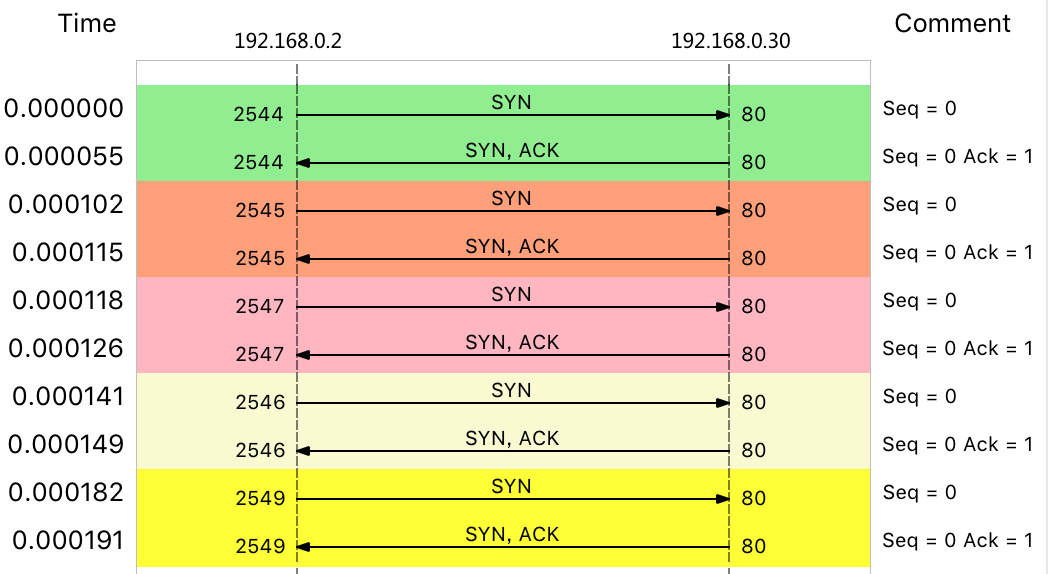
# check TCP package SYN ddos attack tcpdump -i eth0 -n tcp port 80 15:11:32.678966 IP 192.168.0.2.18238 > 192.168.0.30.80: Flags [S], seq 458303614, win 512, length 0 ...
summary
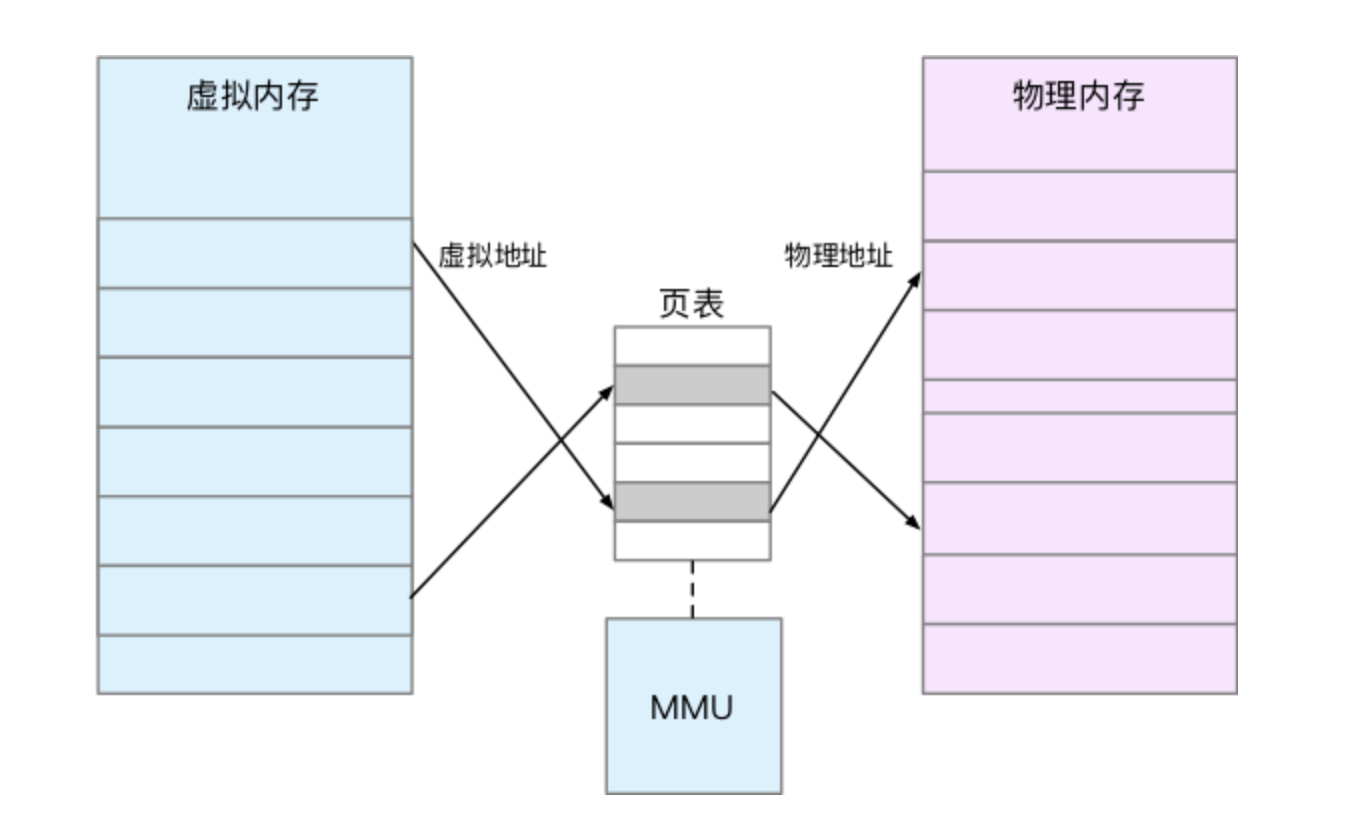
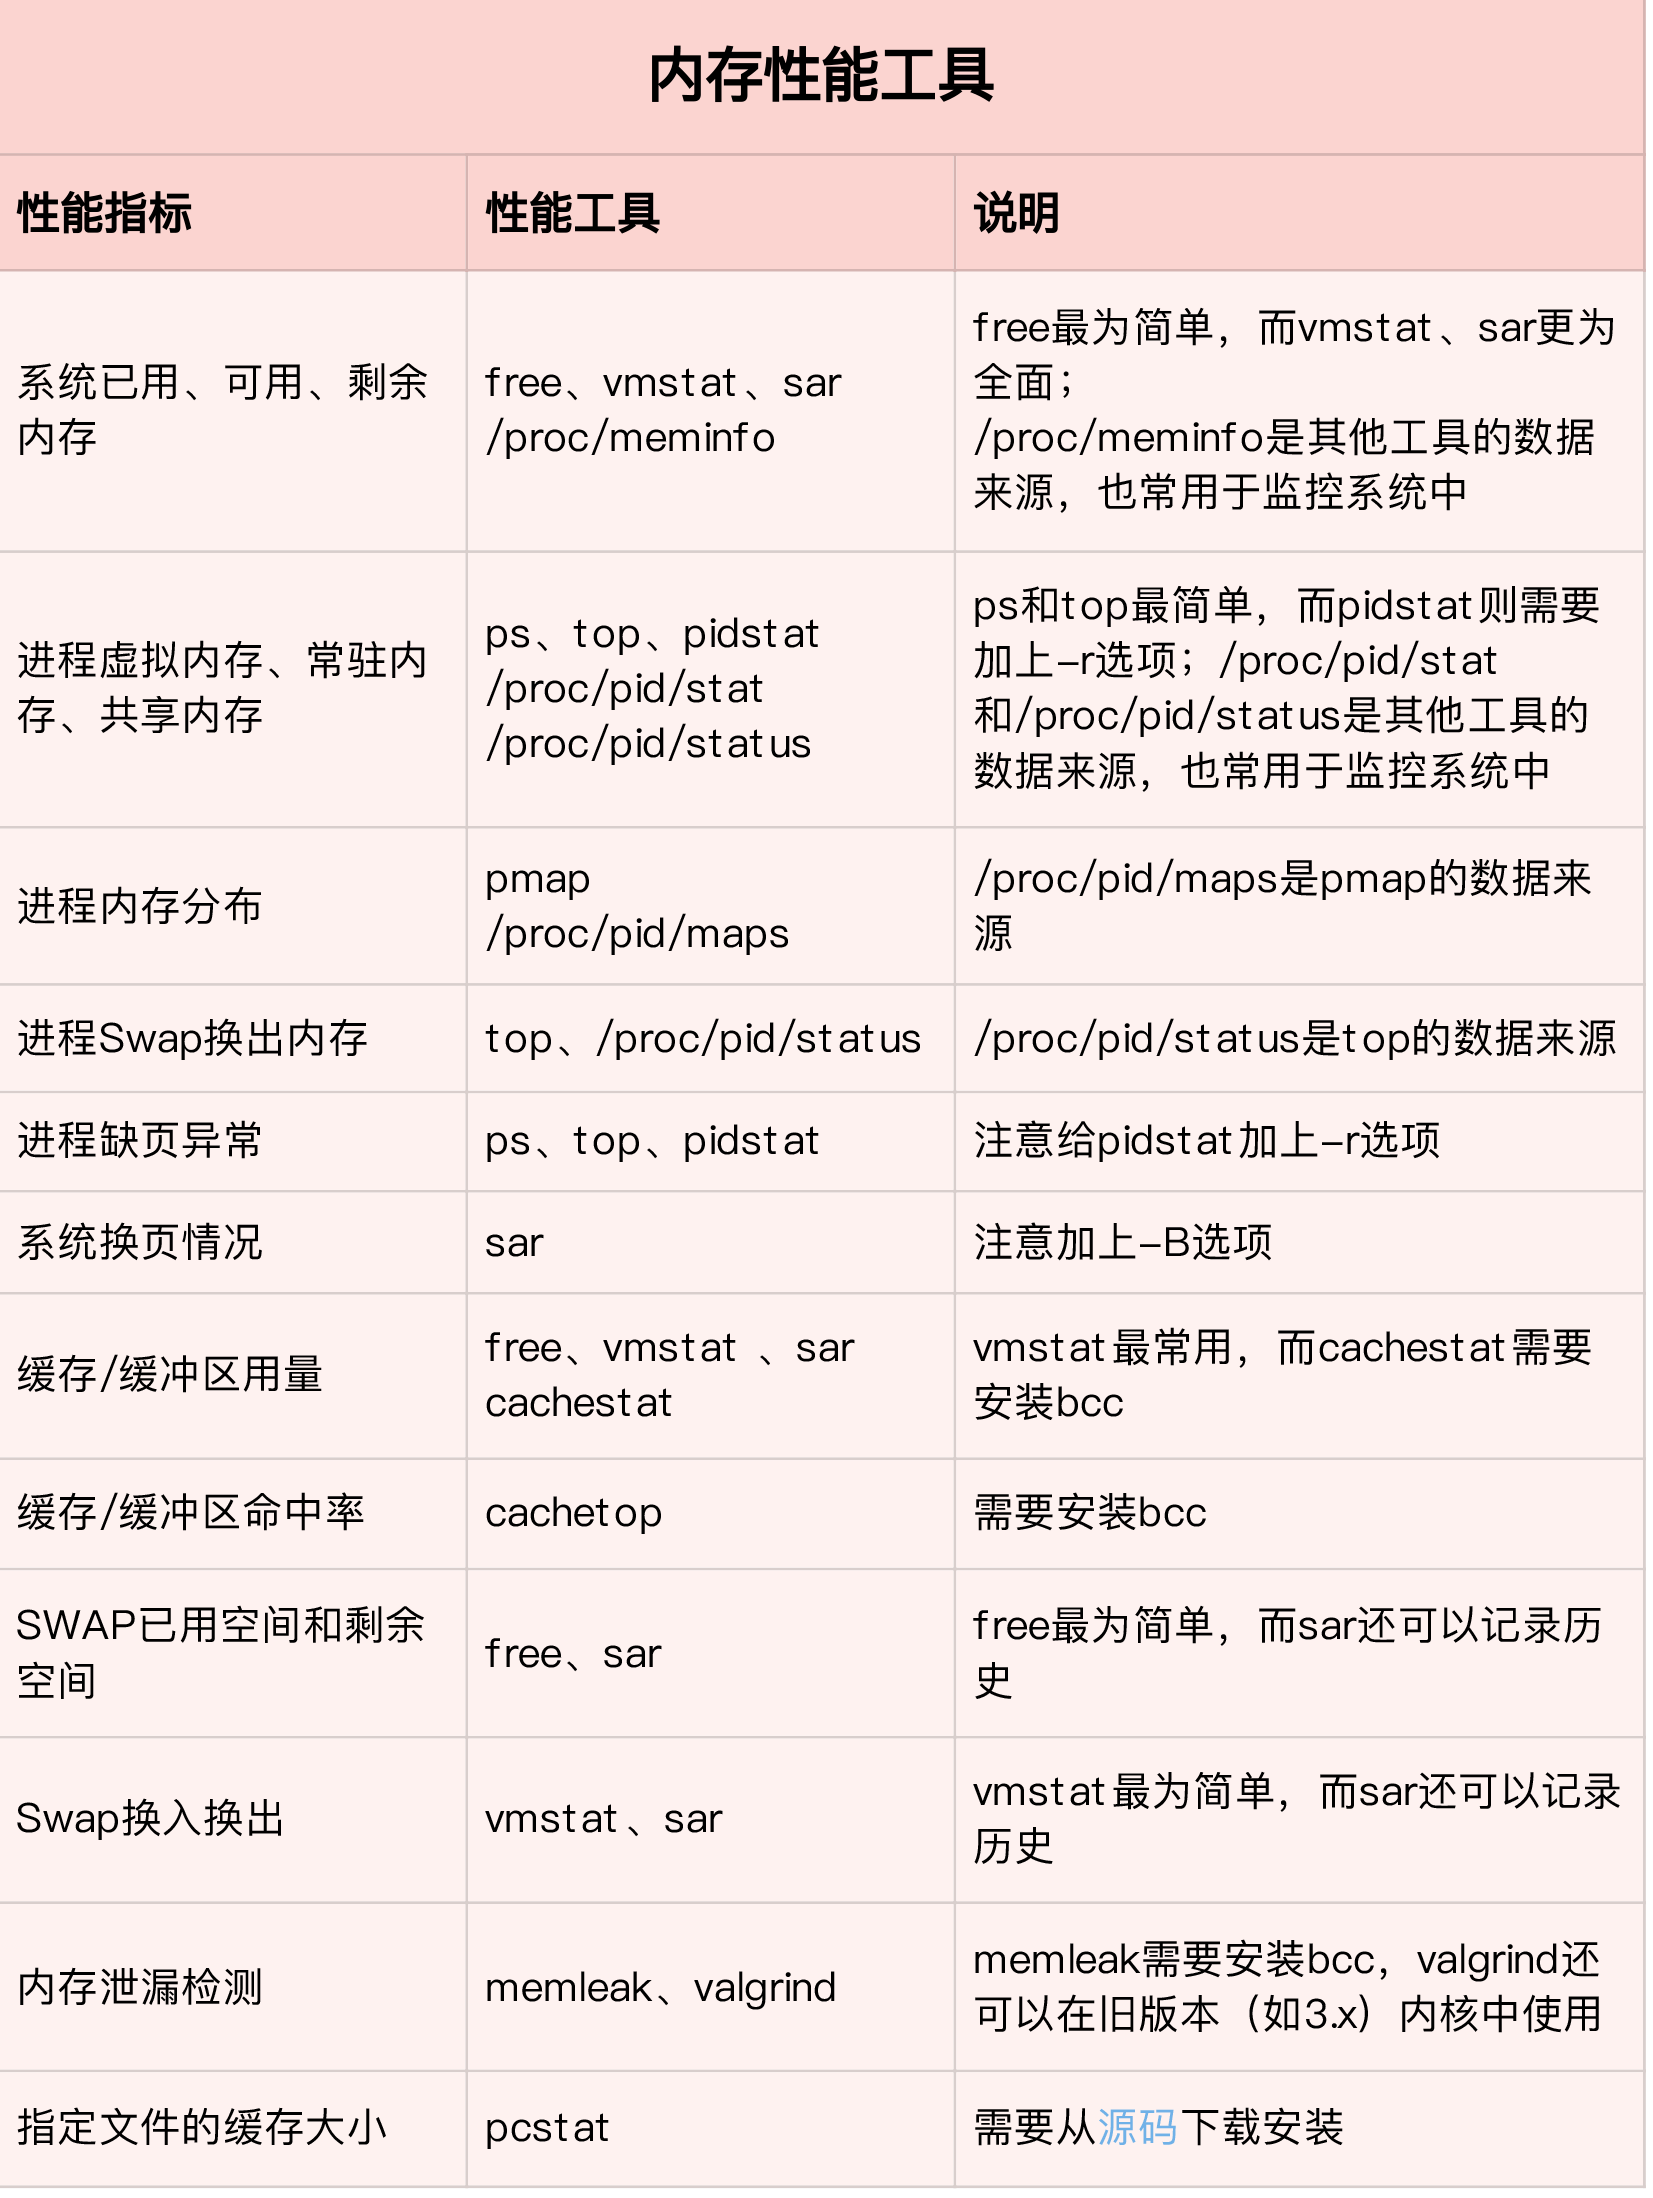
Memory
buffer & cache
Buffers are temporary storage of raw disk blocks, that is, used to cache data on the disk, usually not particularly large (about 20MB). In this way, the kernel can centralize scattered writes and optimize disk writes in a unified manner. For example, multiple small writes can be combined into a single large write.
Cached is a page cache that reads files from disk, that is, it is used to cache data read from files. This way, the next time you access these file data, you can quickly get it directly from memory without having to access the slow disk again.
SReclaimable is part of Slab. Slab consists of two parts, the recyclable part is recorded with SReclaimable; the non-recyclable part is recorded with SUnreclaim.
# Before using cachestat and cachetop, we must first install the bcc package sudo apt-key adv --keyserver keyserver.ubuntu.com --recv-keys 4052245BD4284CDD echo"deb https://repo.iovisor.org/apt/xenial xenial main" | sudo tee /etc/apt/sources.list.d/iovisor.list sudo apt-get update sudo apt-get install -y bcc-tools libbcc-examples linux-headers-$(uname -r)
export PATH=$PATH:/usr/share/bcc/tools
#cachestat provides read and write hits for the entire system cache.
/usr/share/bcc/tools/memleak -a -p $(pidof app) WARNING: Couldn't find .text section in /app WARNING: BCC can't handle sym look ups for /app addr = 7f8f704732b0 size = 8192 addr = 7f8f704772d0 size = 8192 addr = 7f8f704712a0 size = 8192 addr = 7f8f704752c0 size = 8192 32768 bytes in 4 allocations from stack [unknown] [app] [unknown] [app] start_thread+0xdb [libpthread-2.27.so] # [unknown] is app is in docker
# copy exec file from docker, then to check docker cp app:/app /app /usr/share/bcc/tools/memleak -p $(pidof app) -a Attaching to pid 12512, Ctrl+C to quit. [03:00:41] Top 10 stacks with outstanding allocations: addr = 7f8f70863220 size = 8192 addr = 7f8f70861210 size = 8192 addr = 7f8f7085b1e0 size = 8192 addr = 7f8f7085f200 size = 8192 addr = 7f8f7085d1f0 size = 8192 40960 bytes in 5 allocations from stack fibonacci+0x1f [app] child+0x4f [app] start_thread+0xdb [libpthread-2.27.so]
swap
Data that has been modified by the application and has not yet been written to the disk (that is, dirty pages) must be written to the disk before memory can be released.These dirty pages can generally be written to disk in two ways.
You can use the system call fsync in your application to synchronize dirty pages to disk;
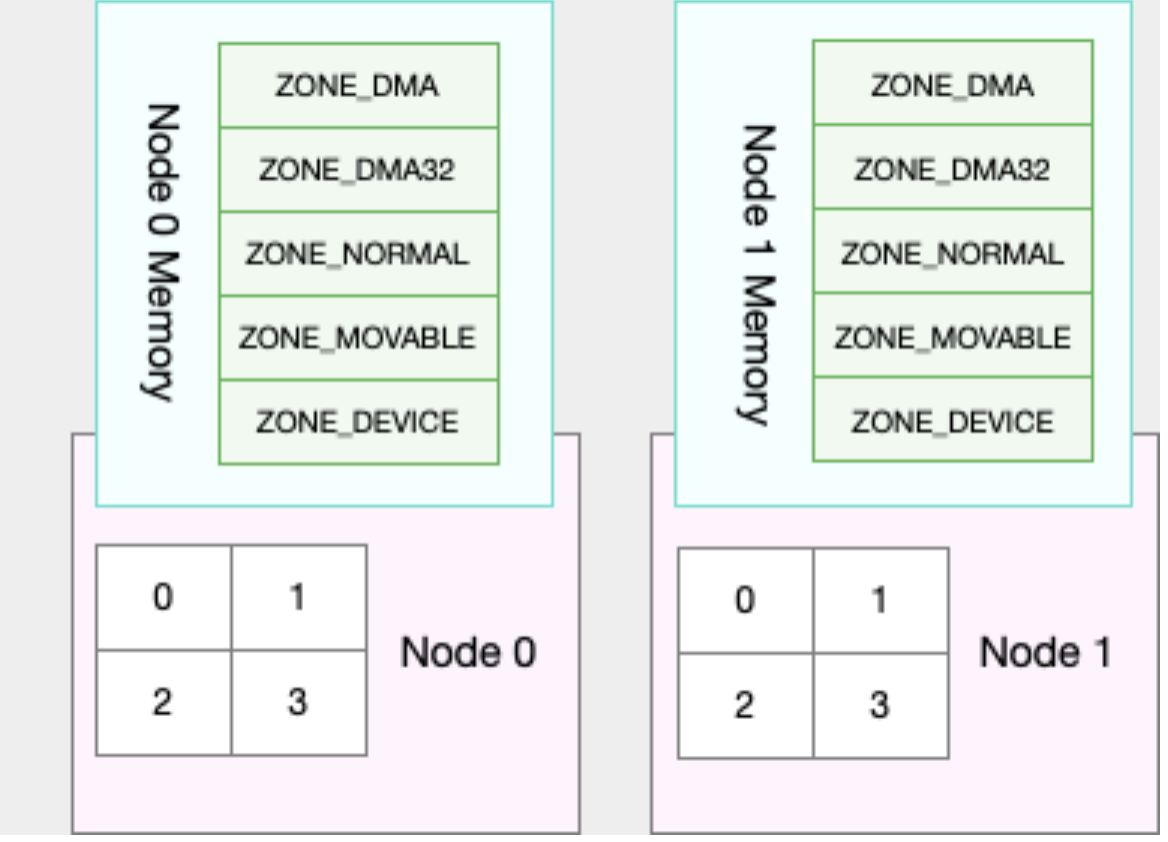
It can also be left to the system, and the kernel thread pdflush is responsible for refreshing these dirty pages. Swap writes these infrequently accessed memory to disk, then releases this memory for use by other more needed processes. When the memory is accessed again, it is sufficient to re-read it from disk. In the NUMA architecture, multiple processors are divided into different nodes, and each node has its own local memory space.
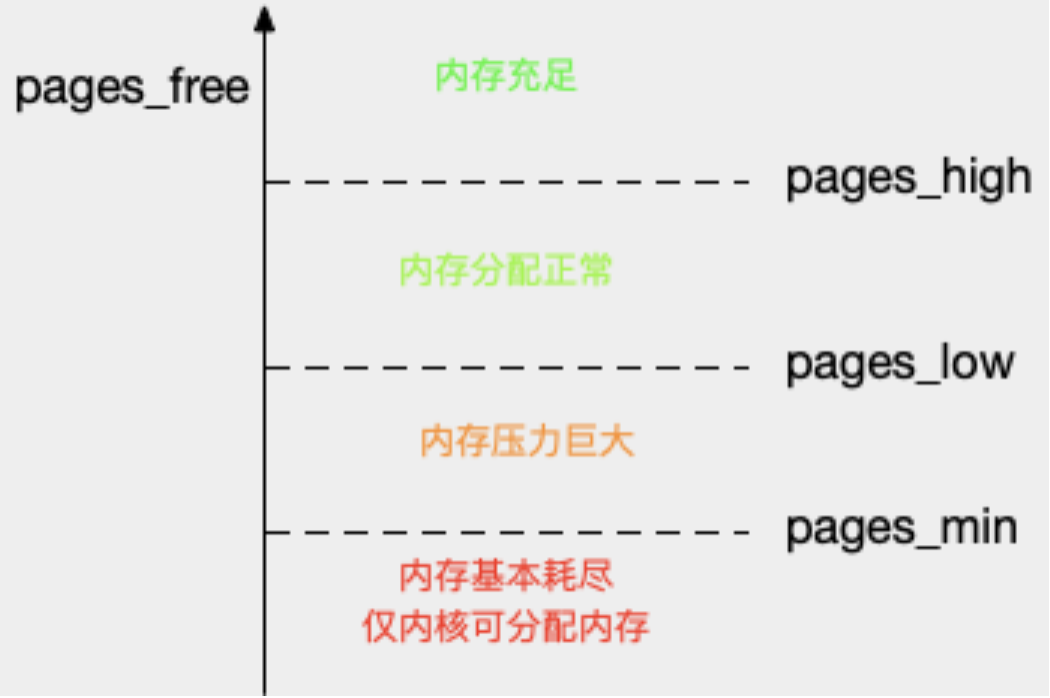
# pages_free fluctuation watch -d grep -A 15 'Normal' /proc/zoneinfo Node 0, zone Normal pages free 21328 min 14896 low 18620 high 22344 spanned 1835008 present 1835008 managed 1796710 protection: (0, 0, 0, 0, 0) nr_free_pages 21328 nr_zone_inactive_anon 79776 nr_zone_active_anon 206854 nr_zone_inactive_file 918561 nr_zone_active_file 496695 nr_zone_unevictable 2251 nr_zone_write_pending 0
# sort by VmSwap for file in /proc/*/status ; do awk '/VmSwap|Name|^Pid/{printf $2 " " $3}END{ print ""}'$file; done | sort -k 3 -n -r | head dockerd 2226 10728 kB docker-containe 2251 8516 kB snapd 936 4020 kB networkd-dispat 911 836 kB polkitd 1004 44 kB
summary
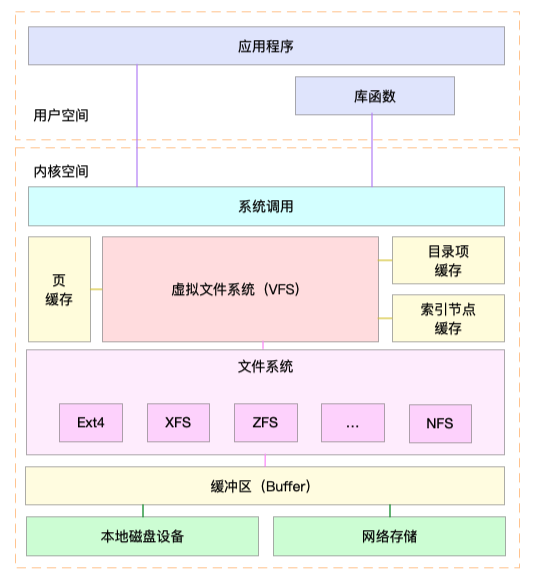
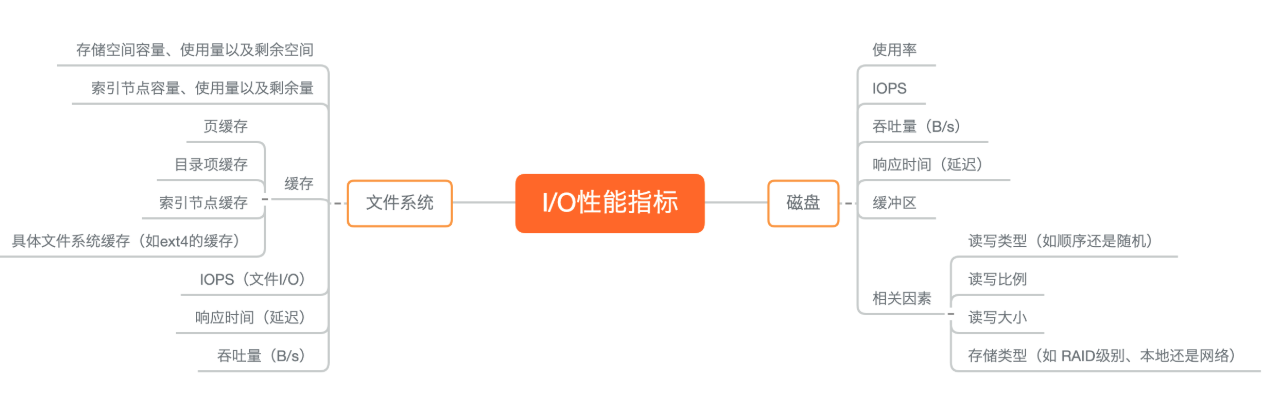
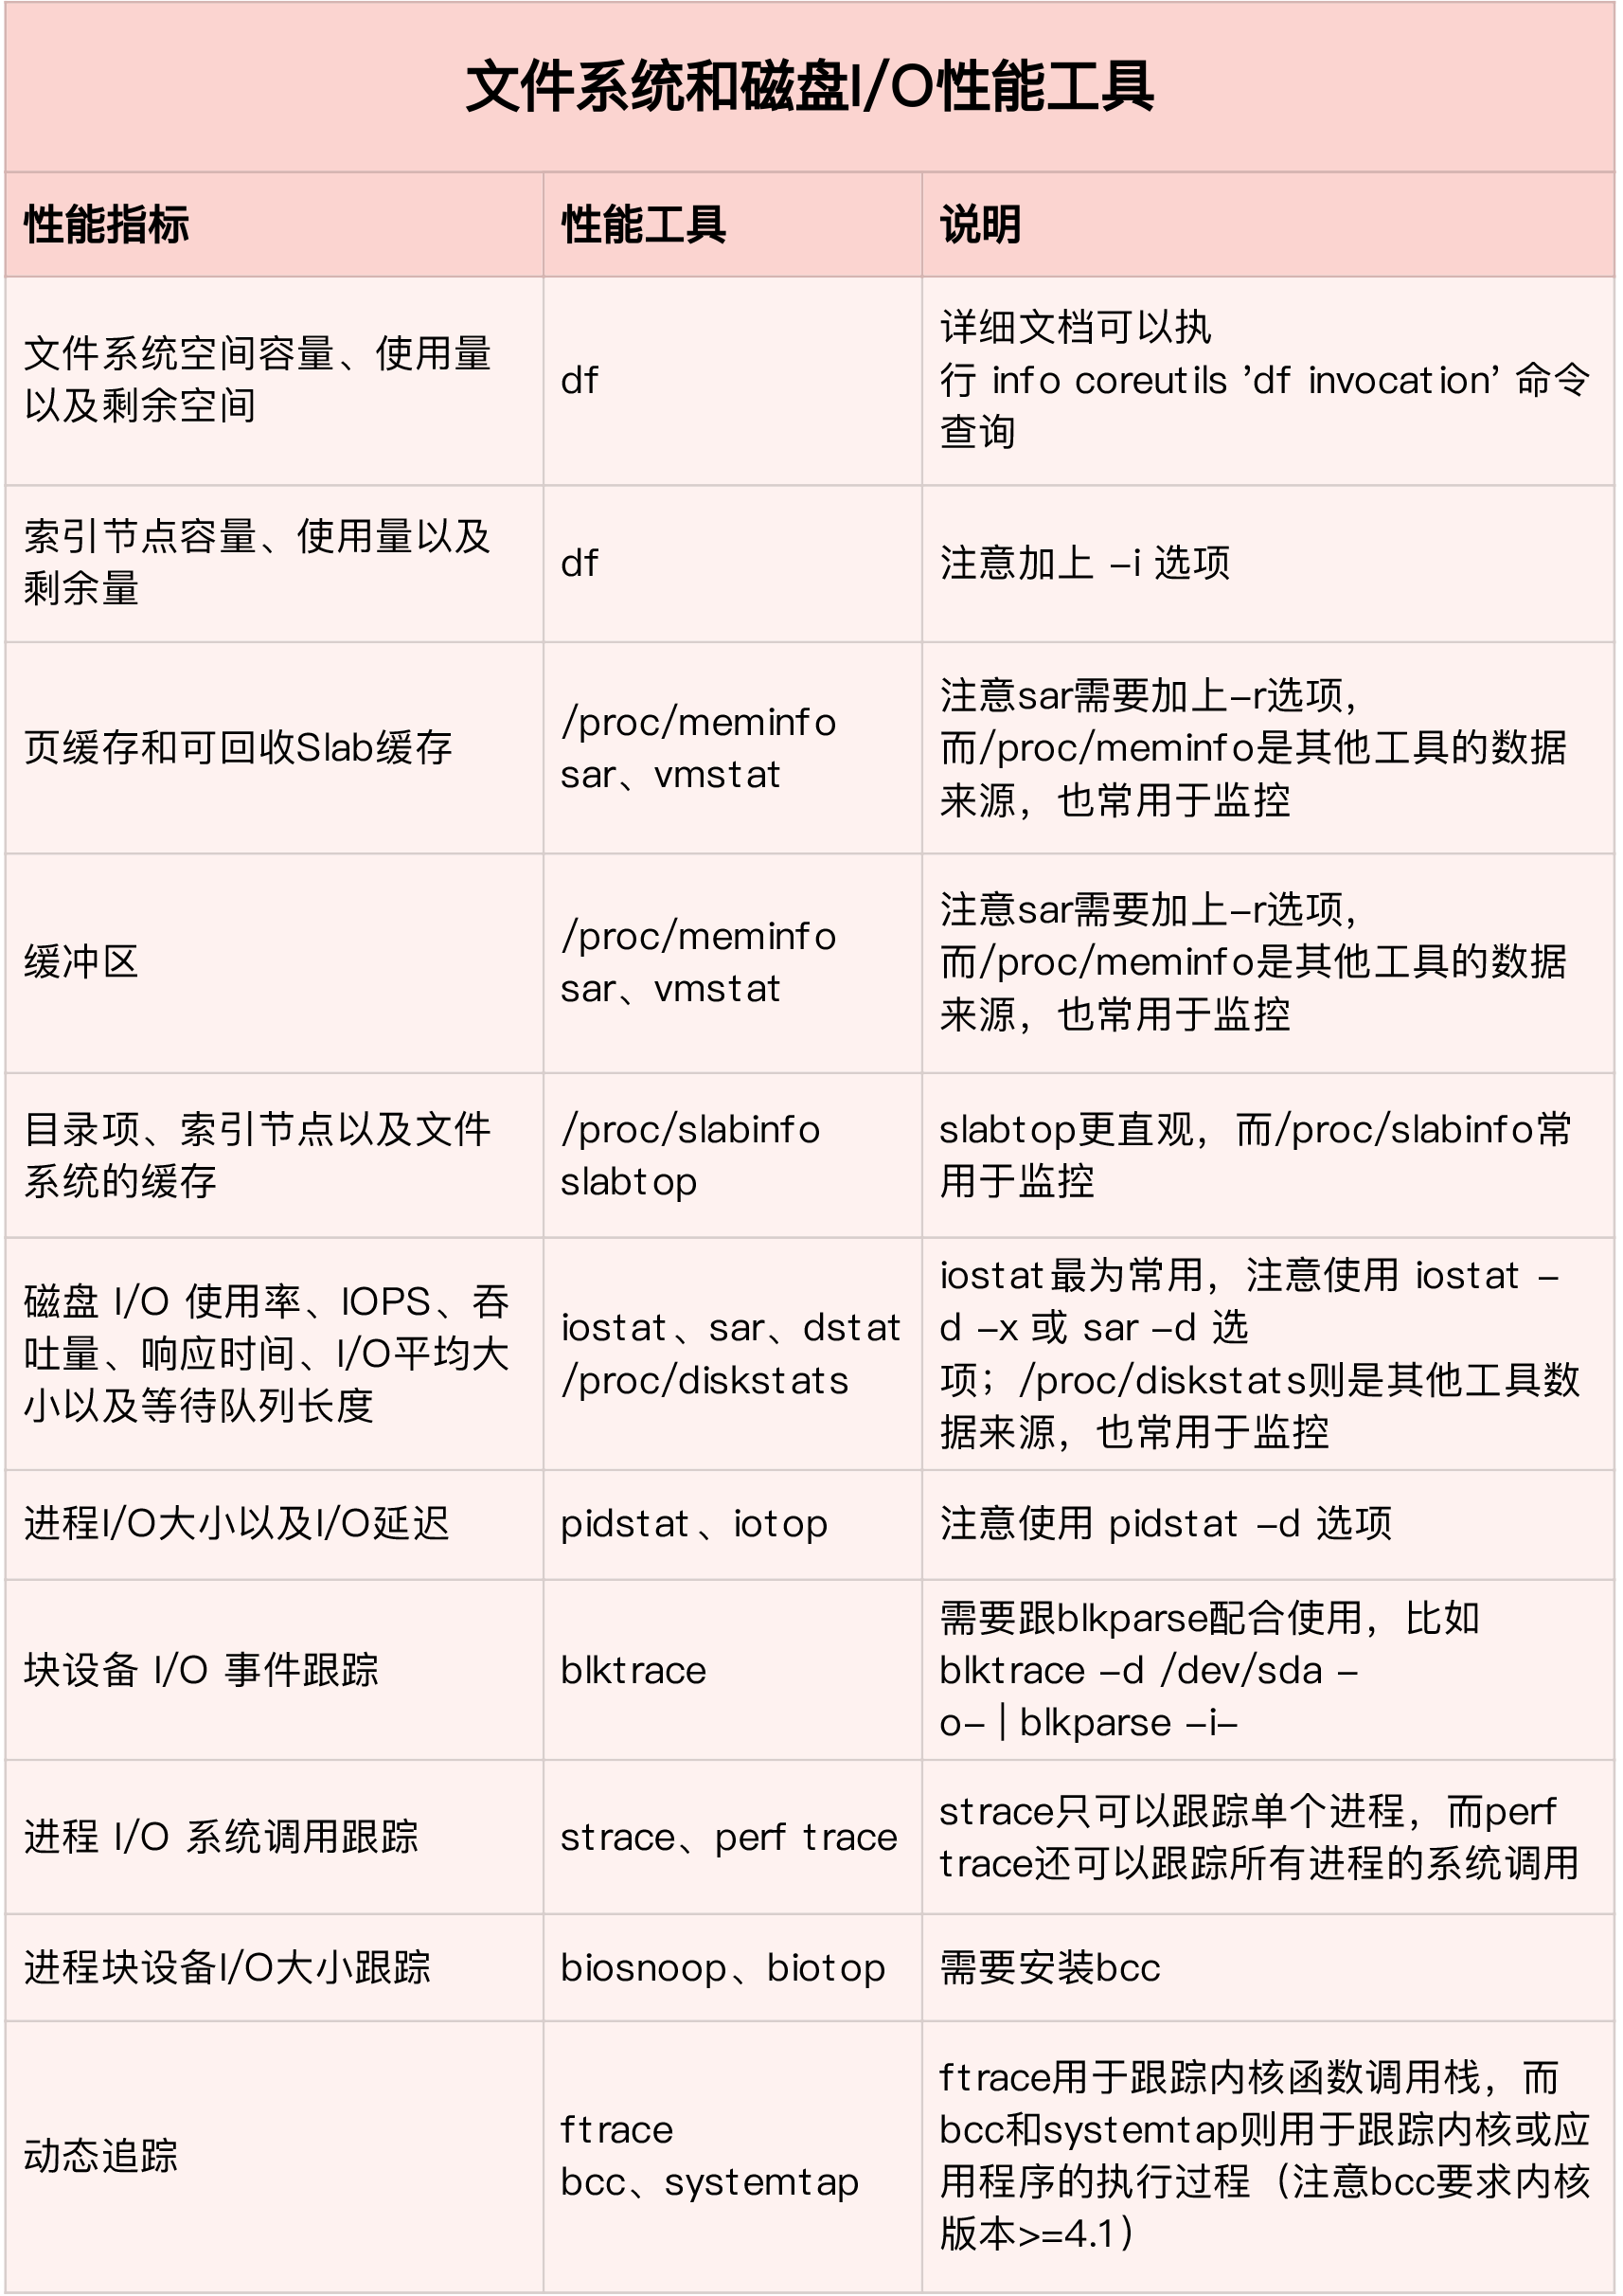
What’s the difference between system and disk ? A disk is a storage device (to be exact, a block device) that can be divided into different disk partitions. On a disk or disk partition, you can also create a file system and mount it in a directory on the system. In this way, the system can read and write files through this mount directory.
In other words, a disk is a block device that stores data and is the carrier of a file system. Therefore, the file system still needs to ensure the persistent storage of data through disk.
You will see this sentence in many places, everything in Linux is a file. In other words, you can access disks and files through the same file interface (such as open, read, write, close, etc.).
What we usually mean by “documents” is actually ordinary documents.
The disk or partition refers to the block device file.
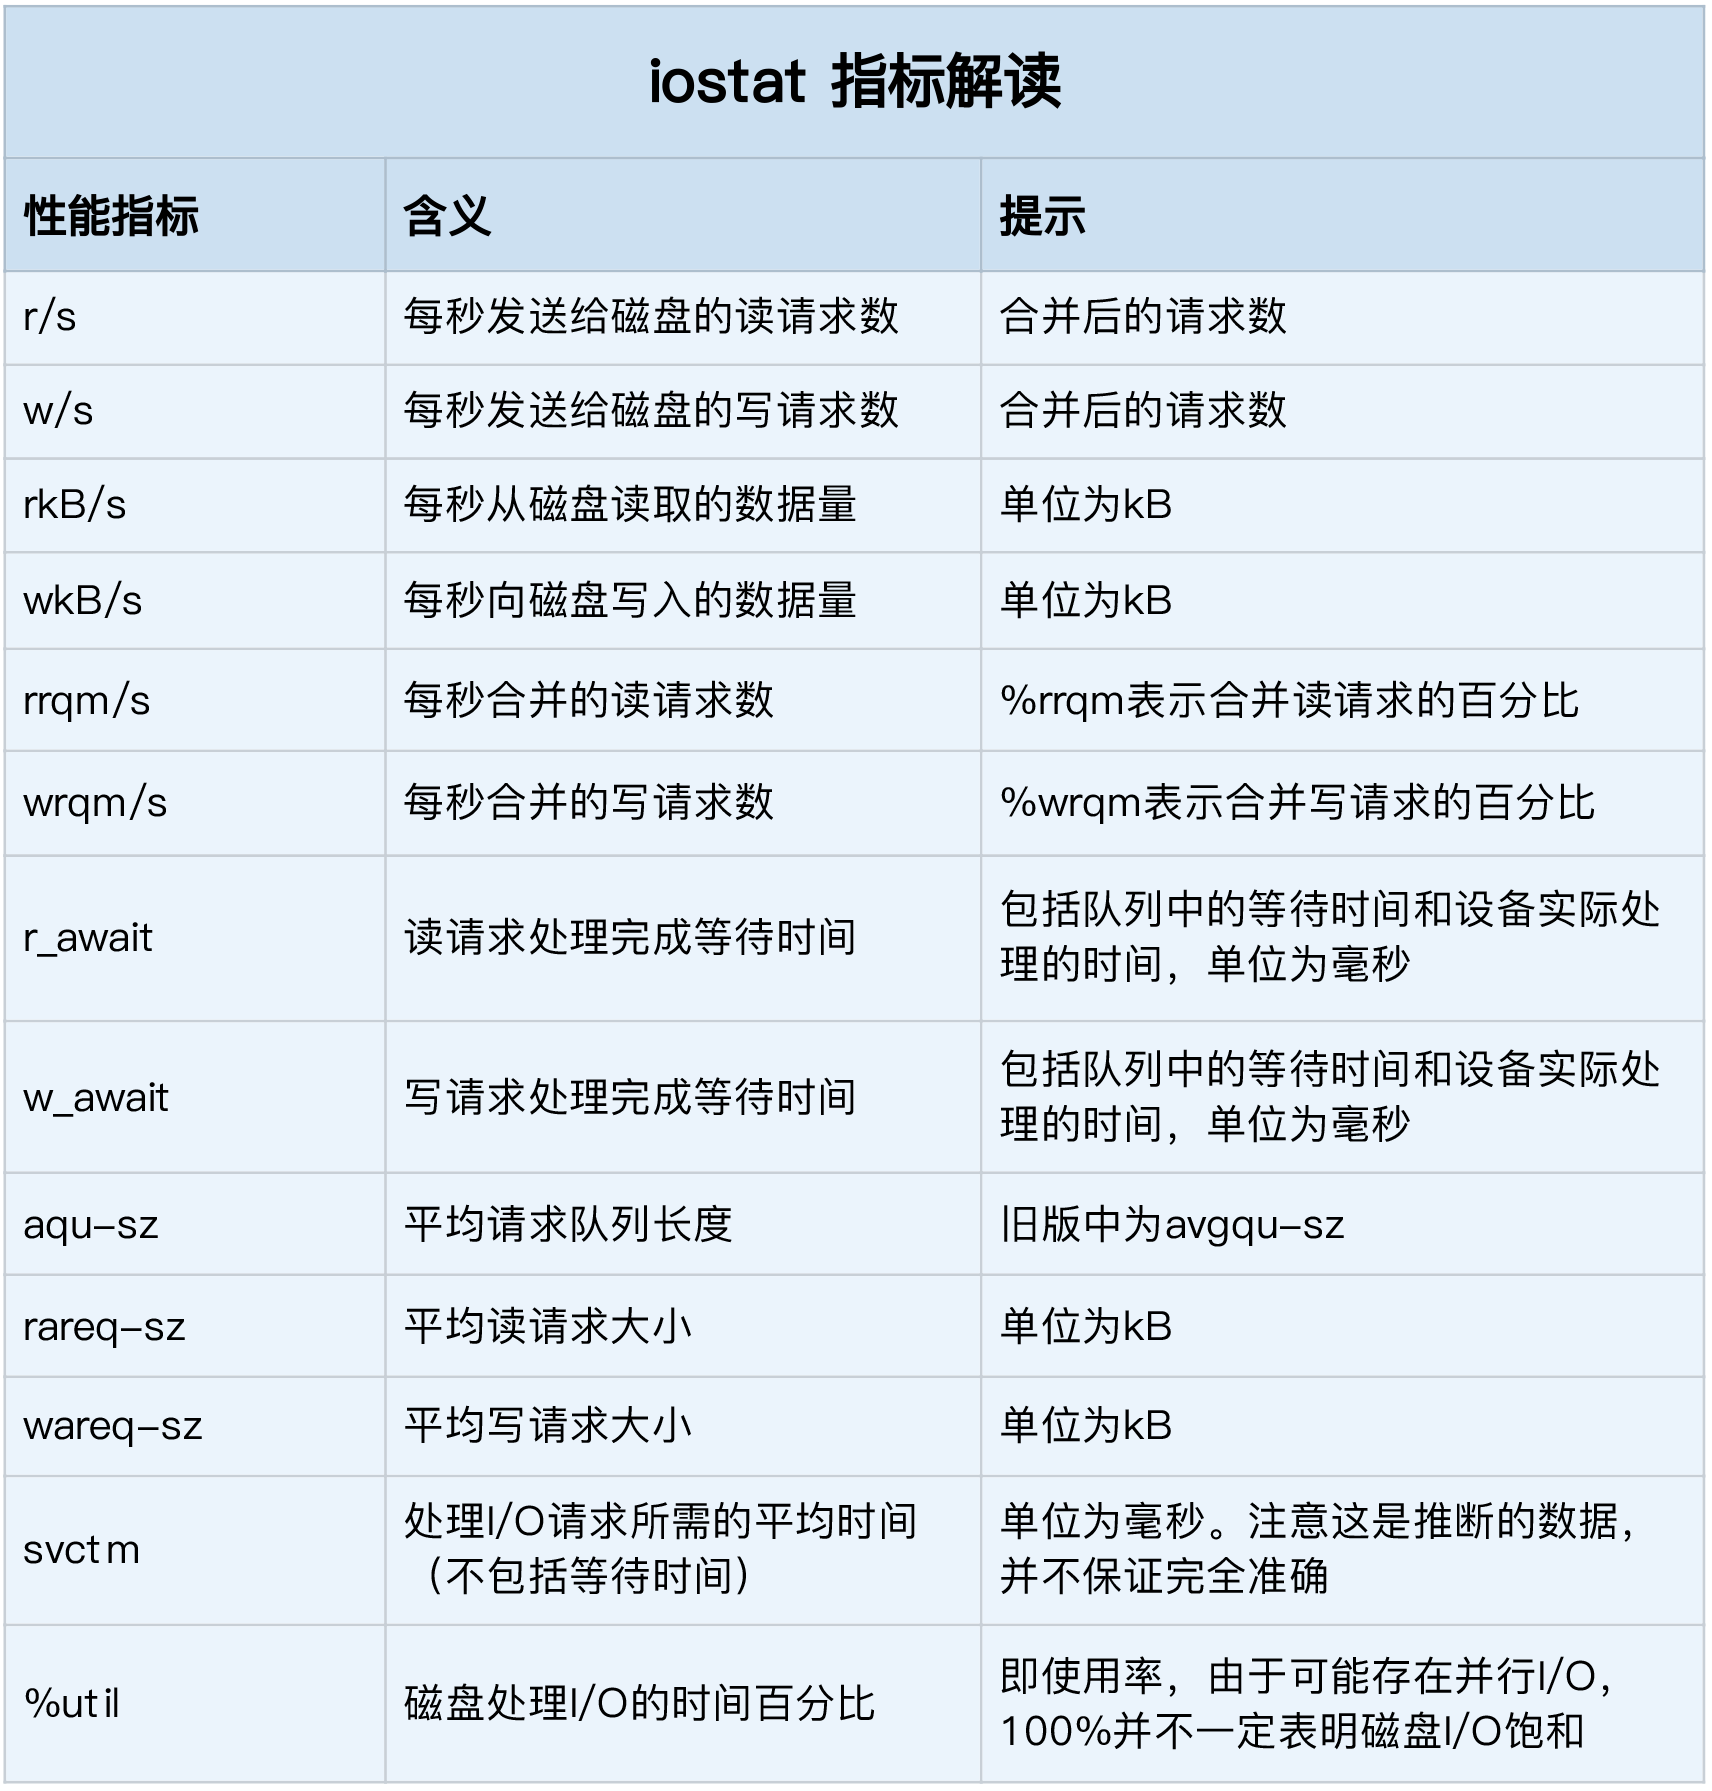
I-O
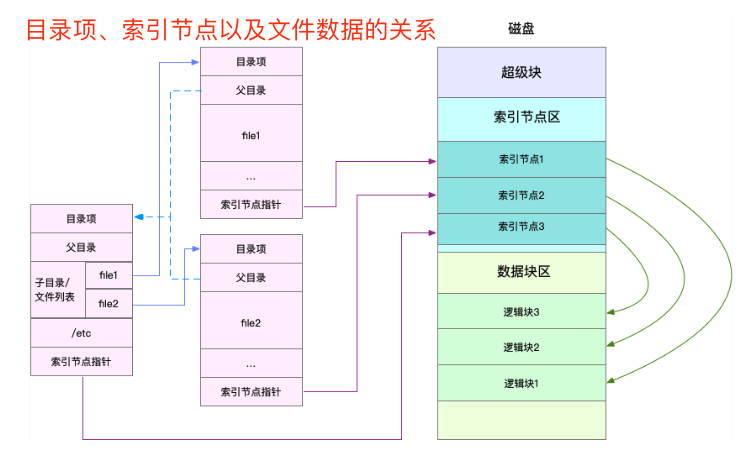
The Linux file system allocates two data structures for each file, an index node and a directory entry. They are mainly used to record the meta information and directory structure of files.
iotop Total DISK READ : 0.00 B/s | Total DISK WRITE : 7.85 K/s Actual DISK READ: 0.00 B/s | Actual DISK WRITE: 0.00 B/s TID PRIO USER DISK READ DISK WRITE SWAPIN IO> COMMAND 15055 be/3 root 0.00 B/s 7.85 K/s 0.00 % 0.00 % systemd-journald
# Thread 28014 is reading a large amount of data, and the descriptor read is 38. # We can execute the following lsof command and specify the thread number 28014, # specifically view this suspicious thread and suspicious file: lsof -p 28014 # no output previous command
# check the previous command, failed echo $? 1
#-t thread -a show command pstree -t -a -p 27458 mysqld,27458 --log_bin=on --sync_binlog=1 ... ├─{mysqld},27922 ├─{mysqld},27923 └─{mysqld},28014
# use pid not thread id lsof -p 27458 COMMAND PID USER FD TYPE DEVICE SIZE/OFF NODE NAME ... mysqld 27458 999 38u REG 8,1 512440000 2601895 /var/lib/mysql/test/products.MYD
# Descriptor number 3 is a pipe, number 5 is an eventpoll # number 7 is an ordinary file, and number 8 is a TCP socket. # Only the 7th ordinary file will generate disk write, # and the file path it operates on is /data/appendonly.aof. # The corresponding system calls include write and fdatasync.
# final check the process in docker PID=$(docker inspect --format {{.State.Pid}} app) nsenter --target $PID --net -- lsof -i COMMAND PID USER FD TYPE DEVICE SIZE/OFF NODE NAME redis-ser 9085 systemd-network 6u IPv4 15447972 0t0 TCP localhost:6379 (LISTEN) redis-ser 9085 systemd-network 8u IPv4 15448709 0t0 TCP localhost:6379->localhost:32996 (ESTABLISHED) python 9181 root 3u IPv4 15448677 0t0 TCP *:http (LISTEN) python 9181 root 5u IPv4 15449632 0t0 TCP localhost:32996->localhost:6379 (ESTABLISHED)
summary
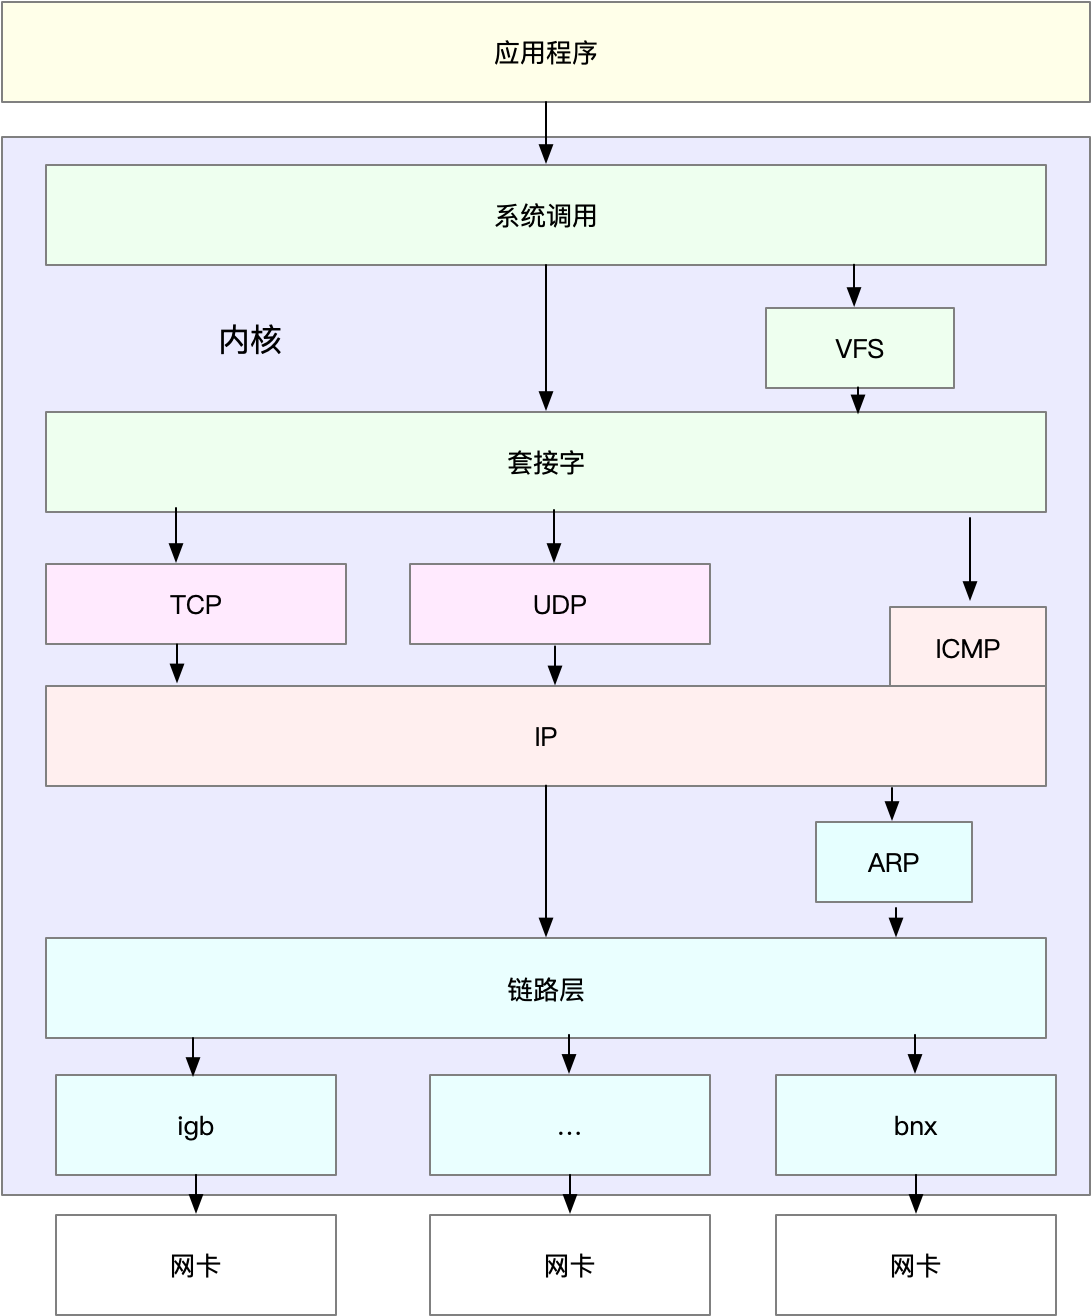
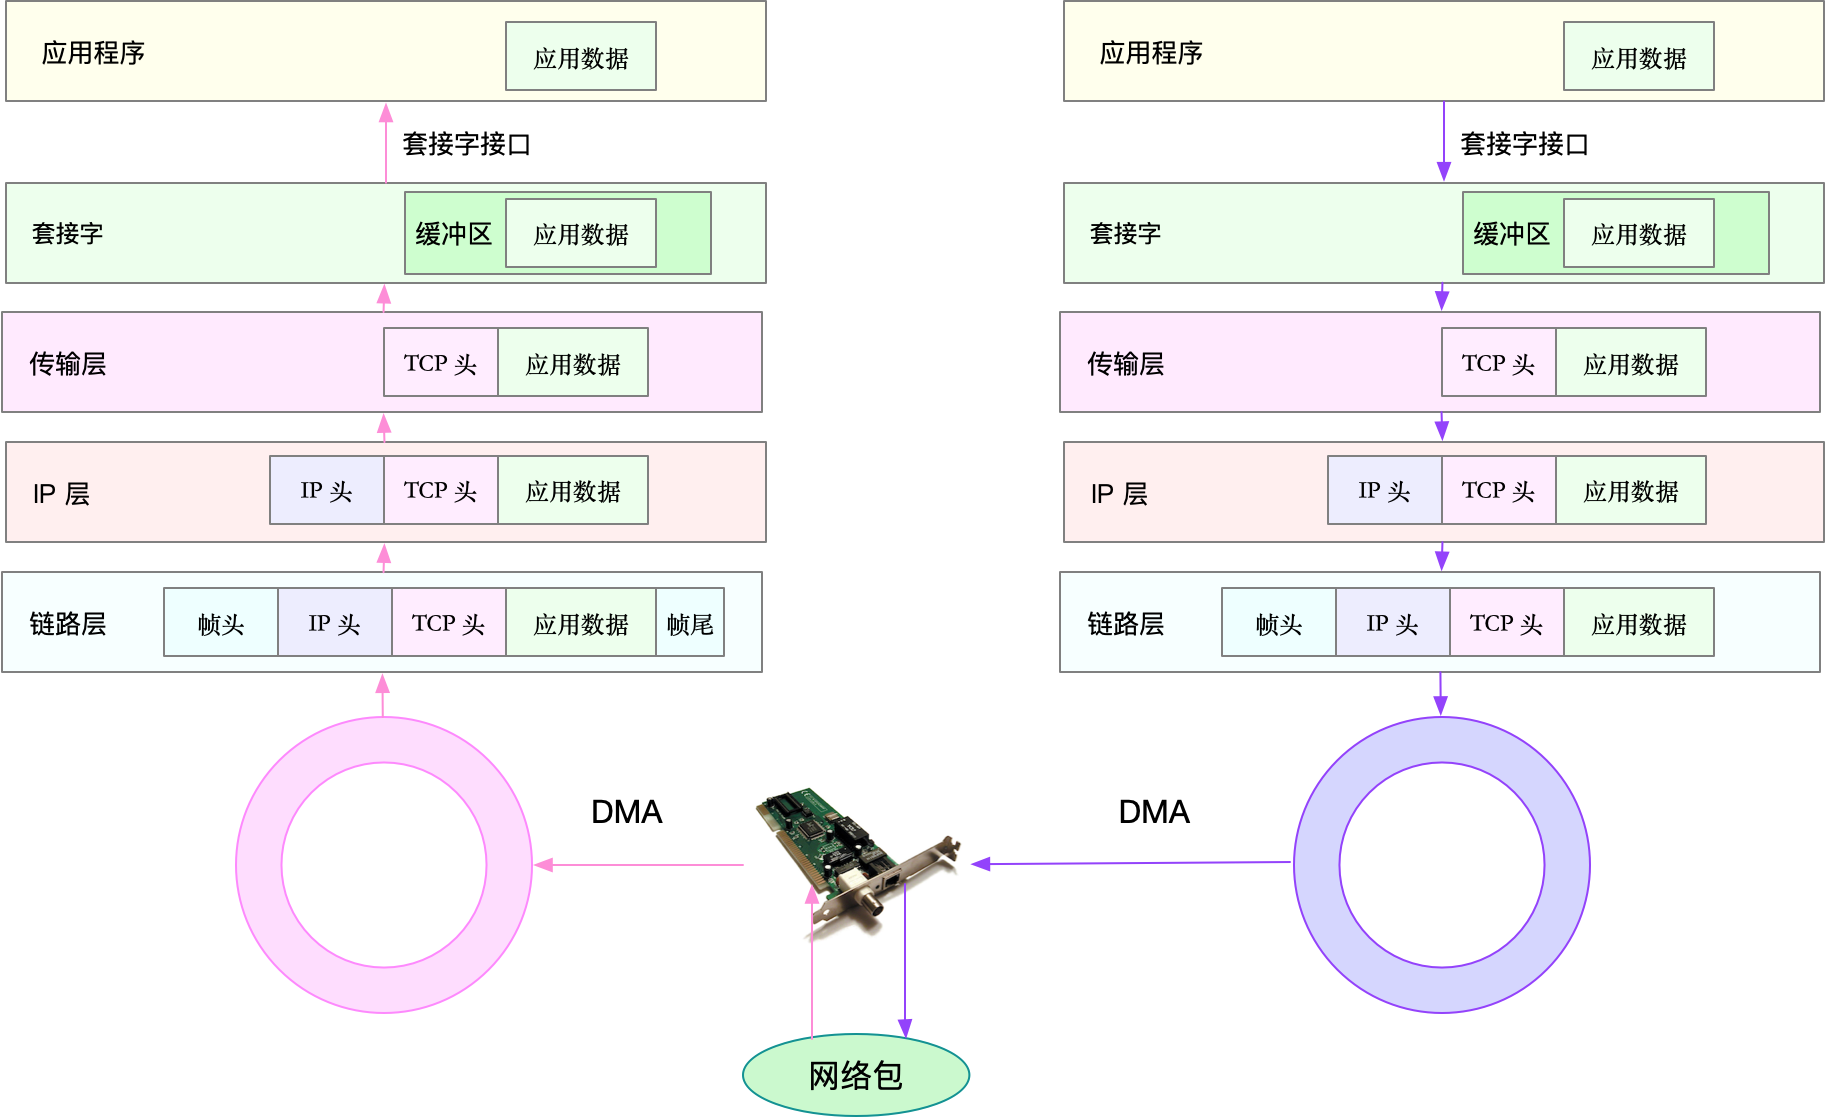
Network
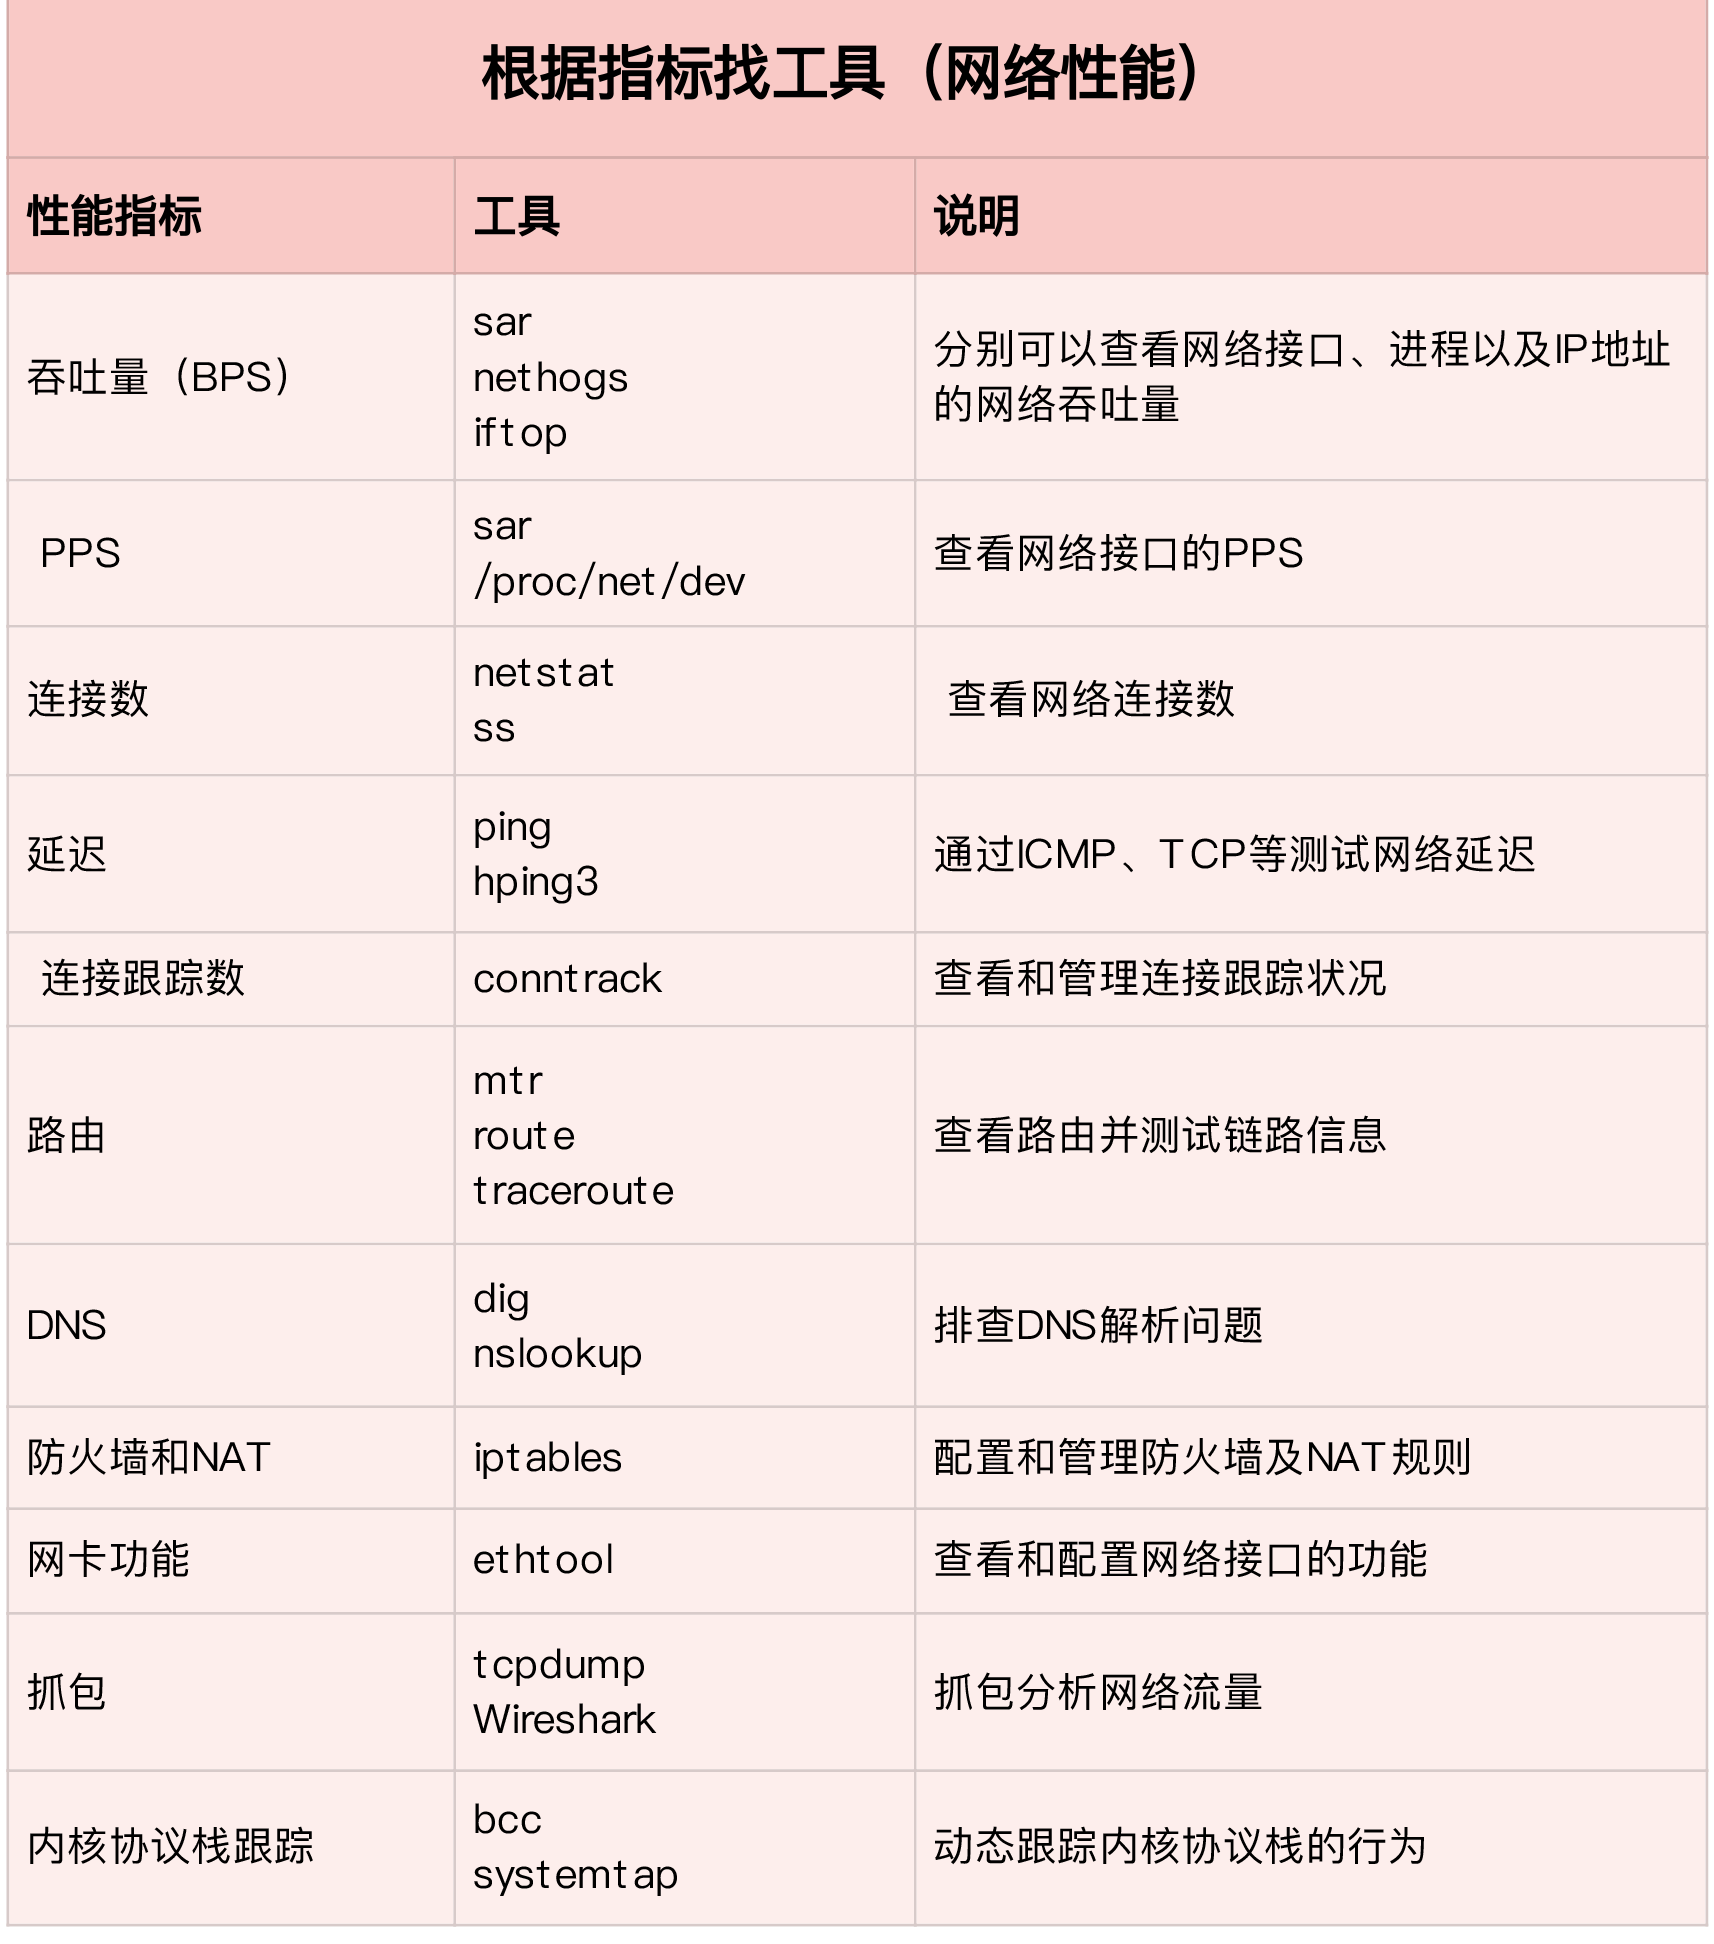
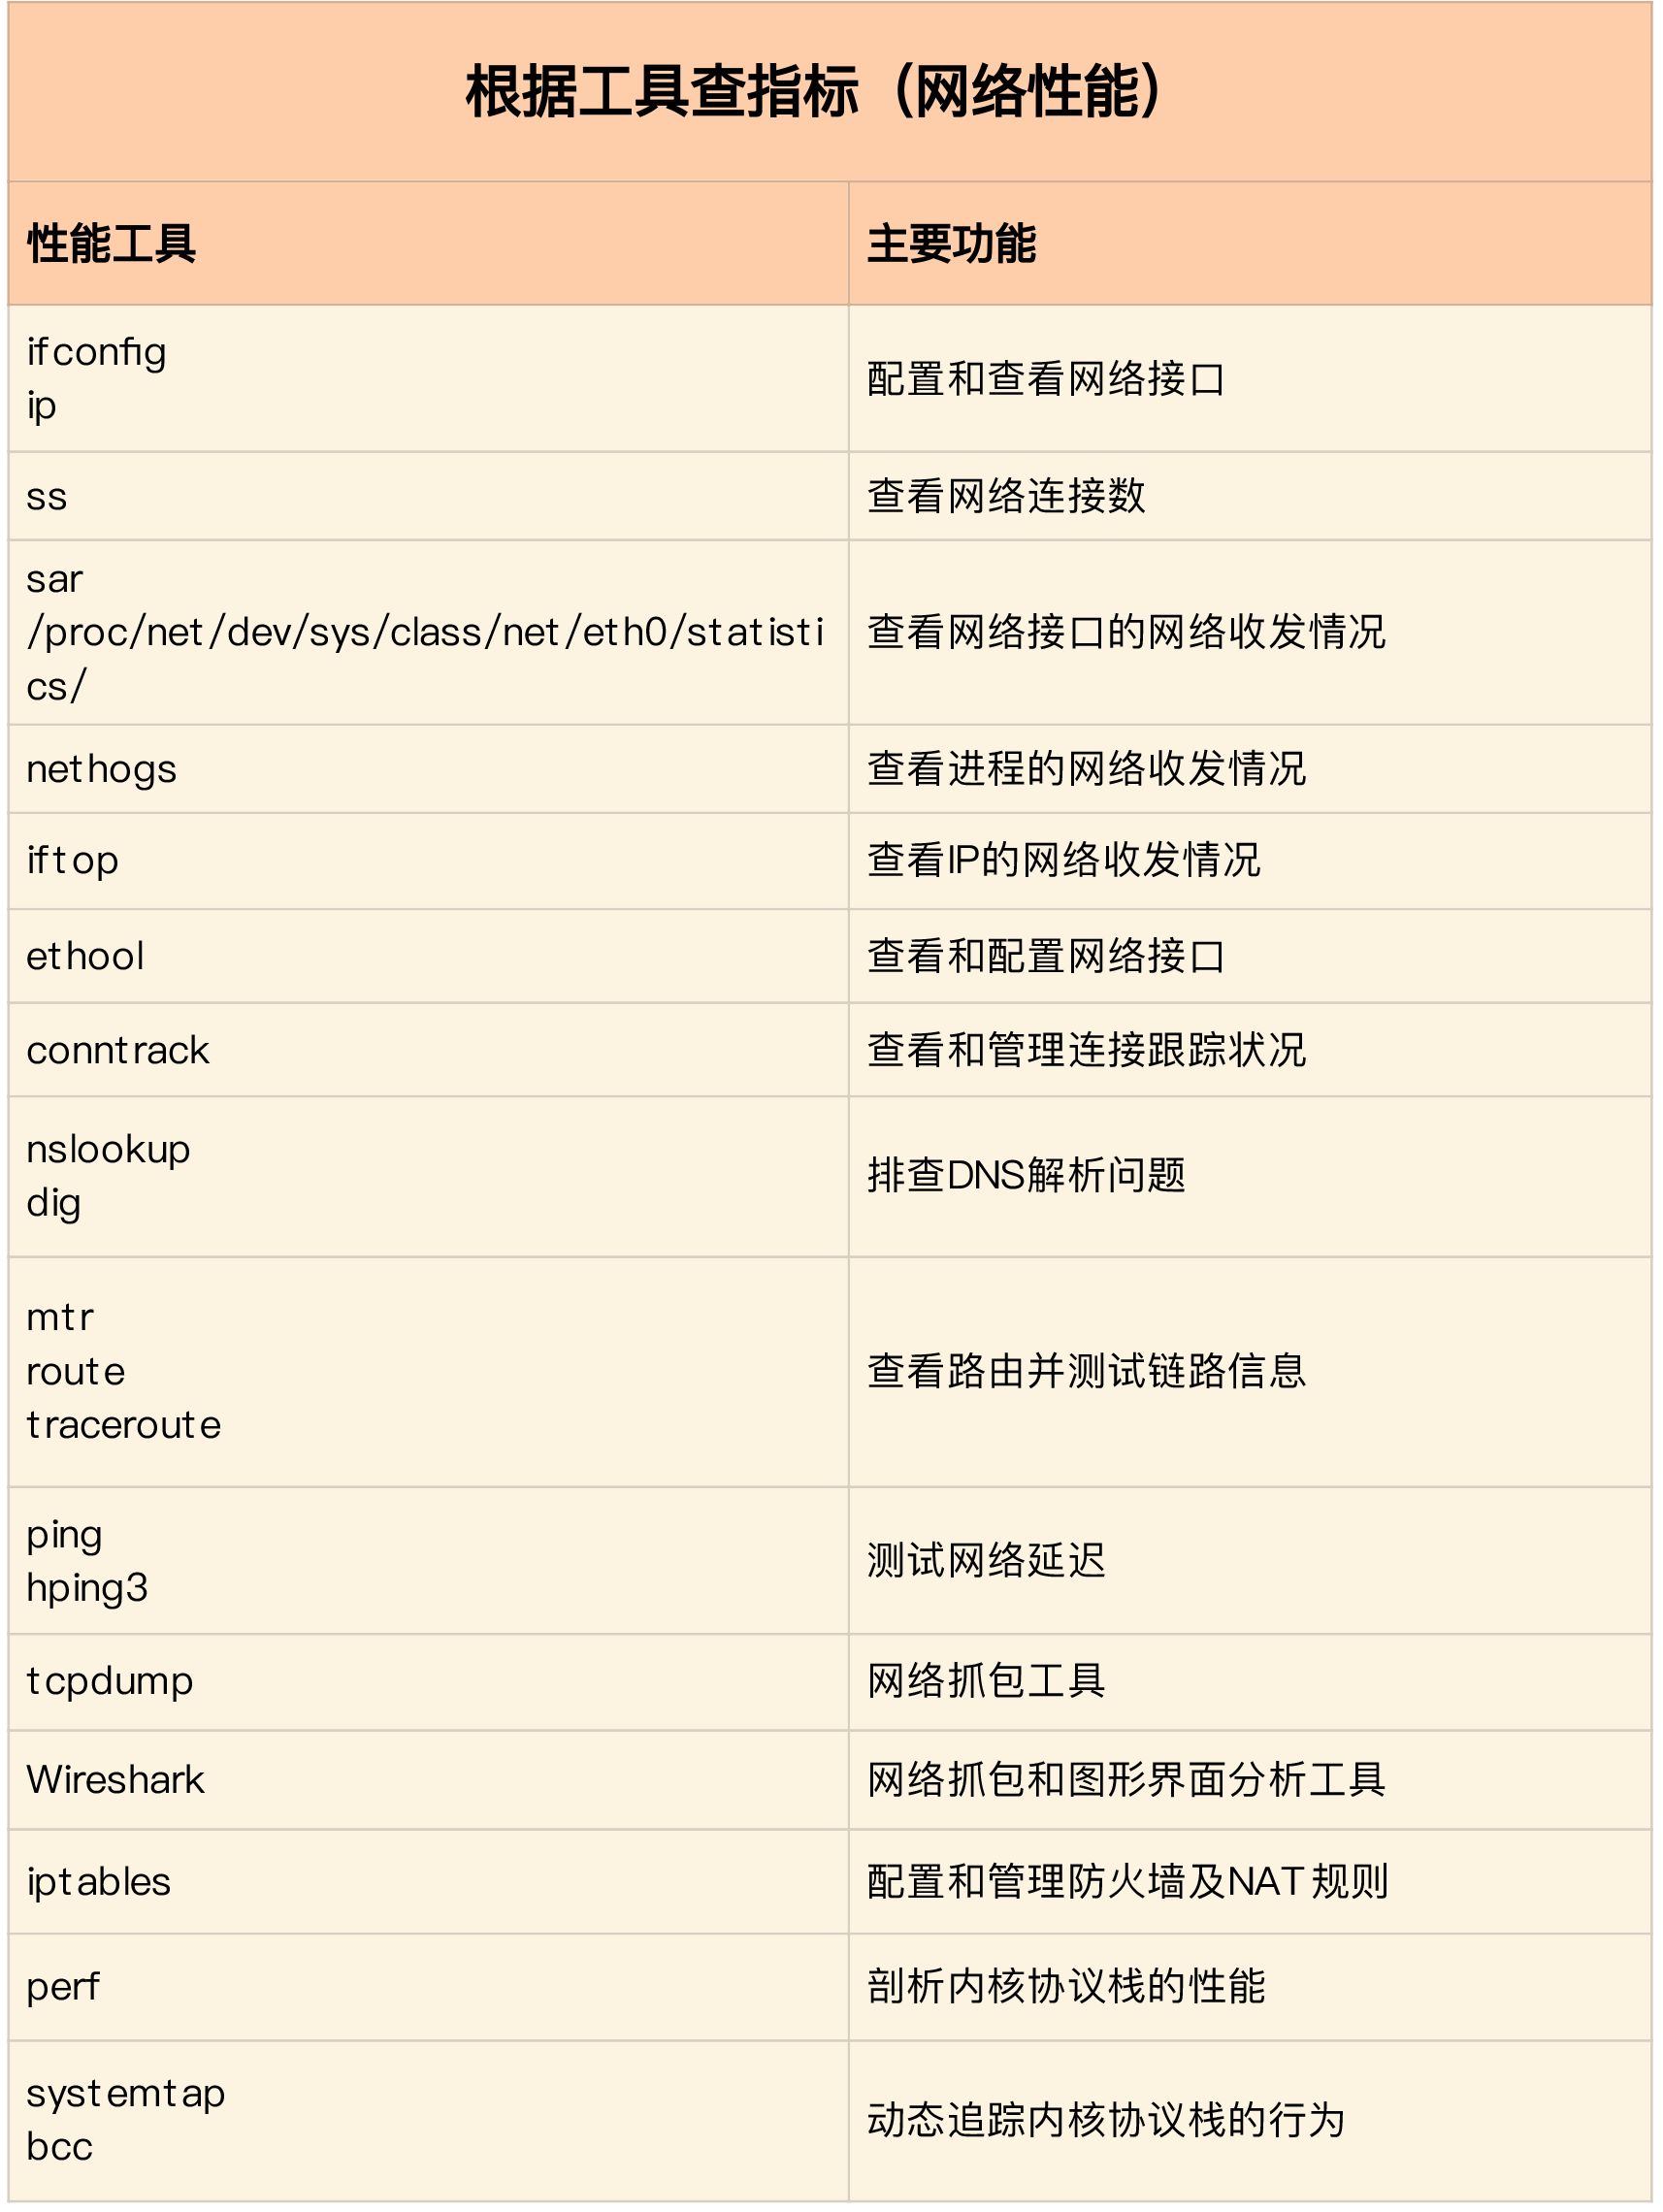
Bandwidth, which indicates the maximum transmission rate of the link. The unit is usually b/s (bits per second).
Throughput, which indicates the amount of data successfully transmitted per unit of time. The unit is usually b/s (bits/second) or B/s (bytes/second). Throughput is limited by bandwidth, and throughput/bandwidth is the utilization of the network.
Delay means the delay from the time the network request is sent until the remote response is received.
PPS is the abbreviation of Packet Per Second (packet per second), which means the transmission rate in network packets.
errors indicates the number of packets with errors, such as check errors, frame synchronization errors, etc.
dropped indicates the number of dropped packets, that is, the packet has received the Ring Buffer, but the packet was lost due to insufficient memory and other reasons;
overruns indicates the number of overrun packets, that is, the network I / O speed is too fast, causing the packets in the Ring Buffer to be too late to be processed (the queue is full) and the packet loss;
carrier indicates the number of packets with carrirer errors, such as mismatch in duplex mode, problems with physical cables, etc .;
collisions indicates the number of collision packets.
1
2
3
4
5
6
7
8
9
10
root@ubuntu:/home/feiyang# netstat -nlp | head -n 3 Active Internet connections (only servers) Proto Recv-Q Send-Q Local Address Foreign Address State PID/Program name tcp 0 0 127.0.0.53:53 0.0.0.0:* LISTEN 549/systemd-resolve
root@ubuntu:/home/feiyang# ss -lntp | head -n 3 State Recv-Q Send-Q Local Address:Port Peer Address:Port LISTEN 0 128 127.0.0.53%lo:53 0.0.0.0:* users:(("systemd-resolve",pid=549,fd=13)) LISTEN 0 128 0.0.0.0:22 0.0.0.0:* users:(("sshd",pid=1040,fd=3))
When the socket is connected (Established), Recv-Q indicates the number of bytes (that is, the length of the receive queue) that the socket buffer has not been taken away by the application. Send-Q indicates the number of bytes (that is, the length of the send queue) that have not been acknowledged by the remote host.
When the socket is in the listening state (Listening), Recv-Q represents the current value of the syn backlog. Send-Q represents the largest syn backlog value.
The syn backlog is the length of the semi-connected queue in the TCP protocol stack, and accordingly there is also a fully connected queue (accept queue)
multi-process listen same port, need enable SO_REUSEPORT
C1000K’s solution is essentially built on epoll’s non-blocking I / O model.
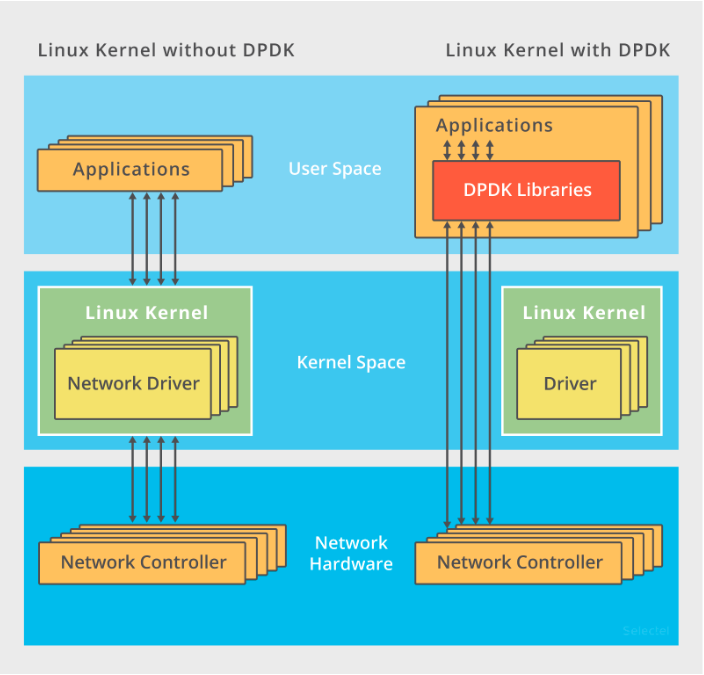
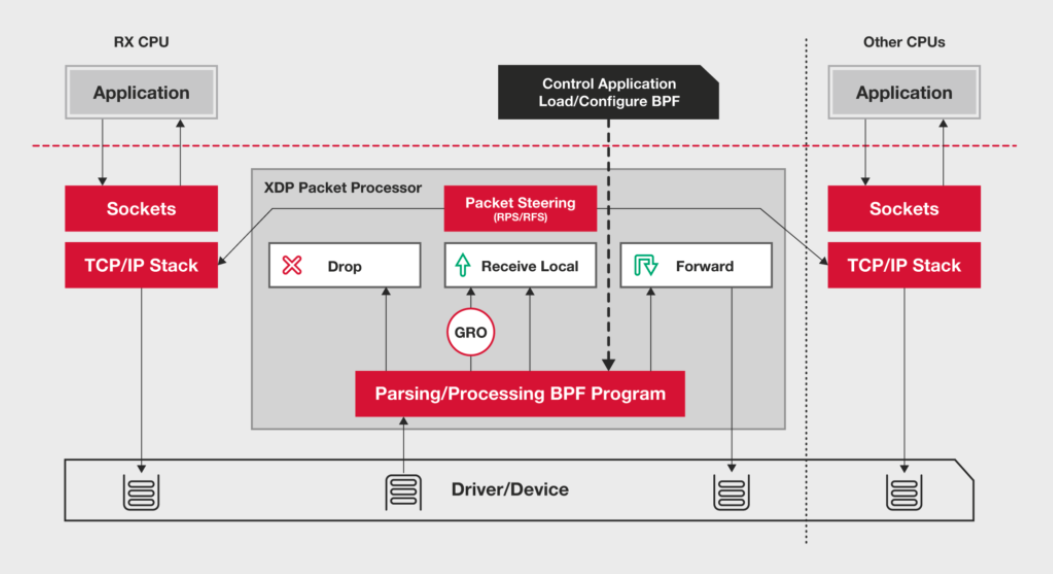
C10M: To solve this problem, the most important thing is to skip the lengthy path of the kernel protocol stack and send the network packets directly to the application to be processed. There are two common mechanisms here, DPDK and XDP.
DPDK is the standard for user mode networks. It skips the kernel protocol stack and directly processes the network reception by the user mode process through polling.
XDP (eXpress Data Path) is a high-performance network data path provided by the Linux kernel. It allows network packets to be processed before entering the kernel protocol stack, which can also bring higher performance. The bottom layer of XDP, like the bcc-tools we used before, is implemented based on the eBPF mechanism of the Linux kernel.
ab -c 1000 -n 10000 http://192.168.0.30/ ... Server Software: nginx/1.15.8 Server Hostname: 192.168.0.30 Server Port: 80 ... Requests per second: 1078.54 [#/sec] (mean) Time per request: 927.183 [ms] (mean) Time per request: 0.927 [ms] (mean, across all concurrent requests) Transfer rate: 890.00 [Kbytes/sec] received Connection Times (ms) min mean[+/-sd] median max Connect: 0 27 152.1 1 1038 Processing: 9 207 843.0 22 9242 Waiting: 8 207 843.0 22 9242 Total: 15 233 857.7 23 9268 Percentage of the requests served within a certain time (ms) 50% 23 66% 24 75% 24 80% 26 90% 274 95% 1195 98% 2335 99% 4663 100% 9268 (longest request)
# setup add parameter -- example script that demonstrates response handling and -- retrieving an authentication token to set on all future -- requests token = nil path = "/authenticate" request = function() return wrk.format("GET", path) end response = function(status, headers, body) if not token and status == 200 then token = headers["X-Token"] path = "/resource" wrk.headers["X-Token"] = token end end
wrk -c 1000 -t 2 -s auth.lua http://192.168.0.30/
DNS slow
A record, used to translate the domain name into an IP address;
CNAME record for creating aliases;
The NS record indicates the name server address corresponding to the domain name.
root@ubuntu:/home/feiyang/wrk# dig +trace +nodnssec feiyang233.club ; <<>> DiG 9.11.3-1ubuntu1.11-Ubuntu <<>> +trace +nodnssec feiyang233.club ;; global options: +cmd . 7974 IN NS i.root-servers.net. . 7974 IN NS j.root-servers.net. . 7974 IN NS k.root-servers.net. . 7974 IN NS l.root-servers.net. . 7974 IN NS m.root-servers.net. . 7974 IN NS a.root-servers.net. . 7974 IN NS b.root-servers.net. . 7974 IN NS c.root-servers.net. . 7974 IN NS d.root-servers.net. . 7974 IN NS e.root-servers.net. . 7974 IN NS f.root-servers.net. . 7974 IN NS g.root-servers.net. . 7974 IN NS h.root-servers.net. ;; Received 431 bytes from 1.1.1.1#53(1.1.1.1) in 8 ms
club. 172800 IN NS ns4.dns.nic.club. club. 172800 IN NS ns1.dns.nic.club. club. 172800 IN NS ns6.dns.nic.club. club. 172800 IN NS ns2.dns.nic.club. club. 172800 IN NS ns3.dns.nic.club. club. 172800 IN NS ns5.dns.nic.club. ;; Received 456 bytes from 192.36.148.17#53(i.root-servers.net) in 104 ms
feiyang233.club. 3600 IN NS f1g1ns1.dnspod.net. feiyang233.club. 3600 IN NS f1g1ns2.dnspod.net. ;; Received 98 bytes from 156.154.144.215#53(ns1.dns.nic.club) in 189 ms
;; Received 44 bytes from 182.140.167.166#53(f1g1ns1.dnspod.net) in 404 ms
no /etc/resolv.conf
1 2 3 4 5
nslookup feiyang233.club ;; connection timed out; no servers could be reached
# add DNS echo"nameserver 1.1.1.1" > /etc/resolv.conf
DNS unstable
1 2 3 4 5 6 7 8 9 10 11 12 13 14 15 16 17 18 19
time nslookup time.geekbang.org Server: 8.8.8.8 Address: 8.8.8.8#53 Non-authoritative answer: Name: time.geekbang.org Address: 39.106.233.176 real 0m10.349s user 0m0.004s sys 0m0.0
time nslookup time.geekbang.org ;; connection timed out; no servers could be reached real 0m15.011s user 0m0.006s sys 0m0.006s
The DNS server itself has problems, the response is slow and unstable;
The network delay from the client to the DNS server is relatively large;
DNS request or response packets are lost by network devices on the link in some cases.
tcpdump: verbose output suppressed, use -v or -vv for full protocol decode listening on eth0, link-type EN10MB (Ethernet), capture size 262144 bytes 14:02:31.100564 IP 172.16.3.4.56669 > 114.114.114.114.53: 36909+ A? geektime.org. (30) 14:02:31.507699 IP 114.114.114.114.53 > 172.16.3.4.56669: 36909 1/0/0 A 35.190.27.188 (46) 14:02:31.508164 IP 172.16.3.4 > 35.190.27.188: ICMP echo request, id 4356, seq 1, length 64 14:02:31.539667 IP 35.190.27.188 > 172.16.3.4: ICMP echo reply, id 4356, seq 1, length 64 14:02:31.539995 IP 172.16.3.4.60254 > 114.114.114.114.53: 49932+ PTR? 188.27.190.35.in-addr.arpa. (44) 14:02:36.545104 IP 172.16.3.4.60254 > 114.114.114.114.53: 49932+ PTR? 188.27.190.35.in-addr.arpa. (44) 14:02:41.551284 IP 172.16.3.4 > 35.190.27.188: ICMP echo request, id 4356, seq 2, length 64 14:02:41.582363 IP 35.190.27.188 > 172.16.3.4: ICMP echo reply, id 4356, seq 2, length 64 14:02:42.552506 IP 172.16.3.4 > 35.190.27.188: ICMP echo request, id 4356, seq 3, length 64 14:02:42.583646 IP 35.190.27.188 > 172.16.3.4: ICMP echo reply, id 4356, seq 3, length 64
The purpose of PTR reverse address resolution is to find out the domain name from the IP address, but in fact, not all IP addresses will define PTR records, so PTR queries are likely to fail.
1 2 3 4 5 6 7 8 9 10 11 12 13 14 15 16 17
# check PTR
nslookup -type=PTR 35.190.27.188 8.8.8.8 Server: 8.8.8.8 Address: 8.8.8.8#53 Non-authoritative answer: 188.27.190.35.in-addr.arpa name = 188.27.190.35.bc.googleusercontent.com. Authoritative answers can be found from:
# -S set TCP SYN,-p port 80 # -i u10 10us interval hping3 -S -p 80 -i u10 192.168.0.30
# -w only output HTTP status total time -o redirect to /dev/null curl -s -w 'Http code: %{http_code}\nTotal time:%{time_total}s\n' -o /dev/null http://192.168.0.30/ ... Http code: 200 Total time:0.002s
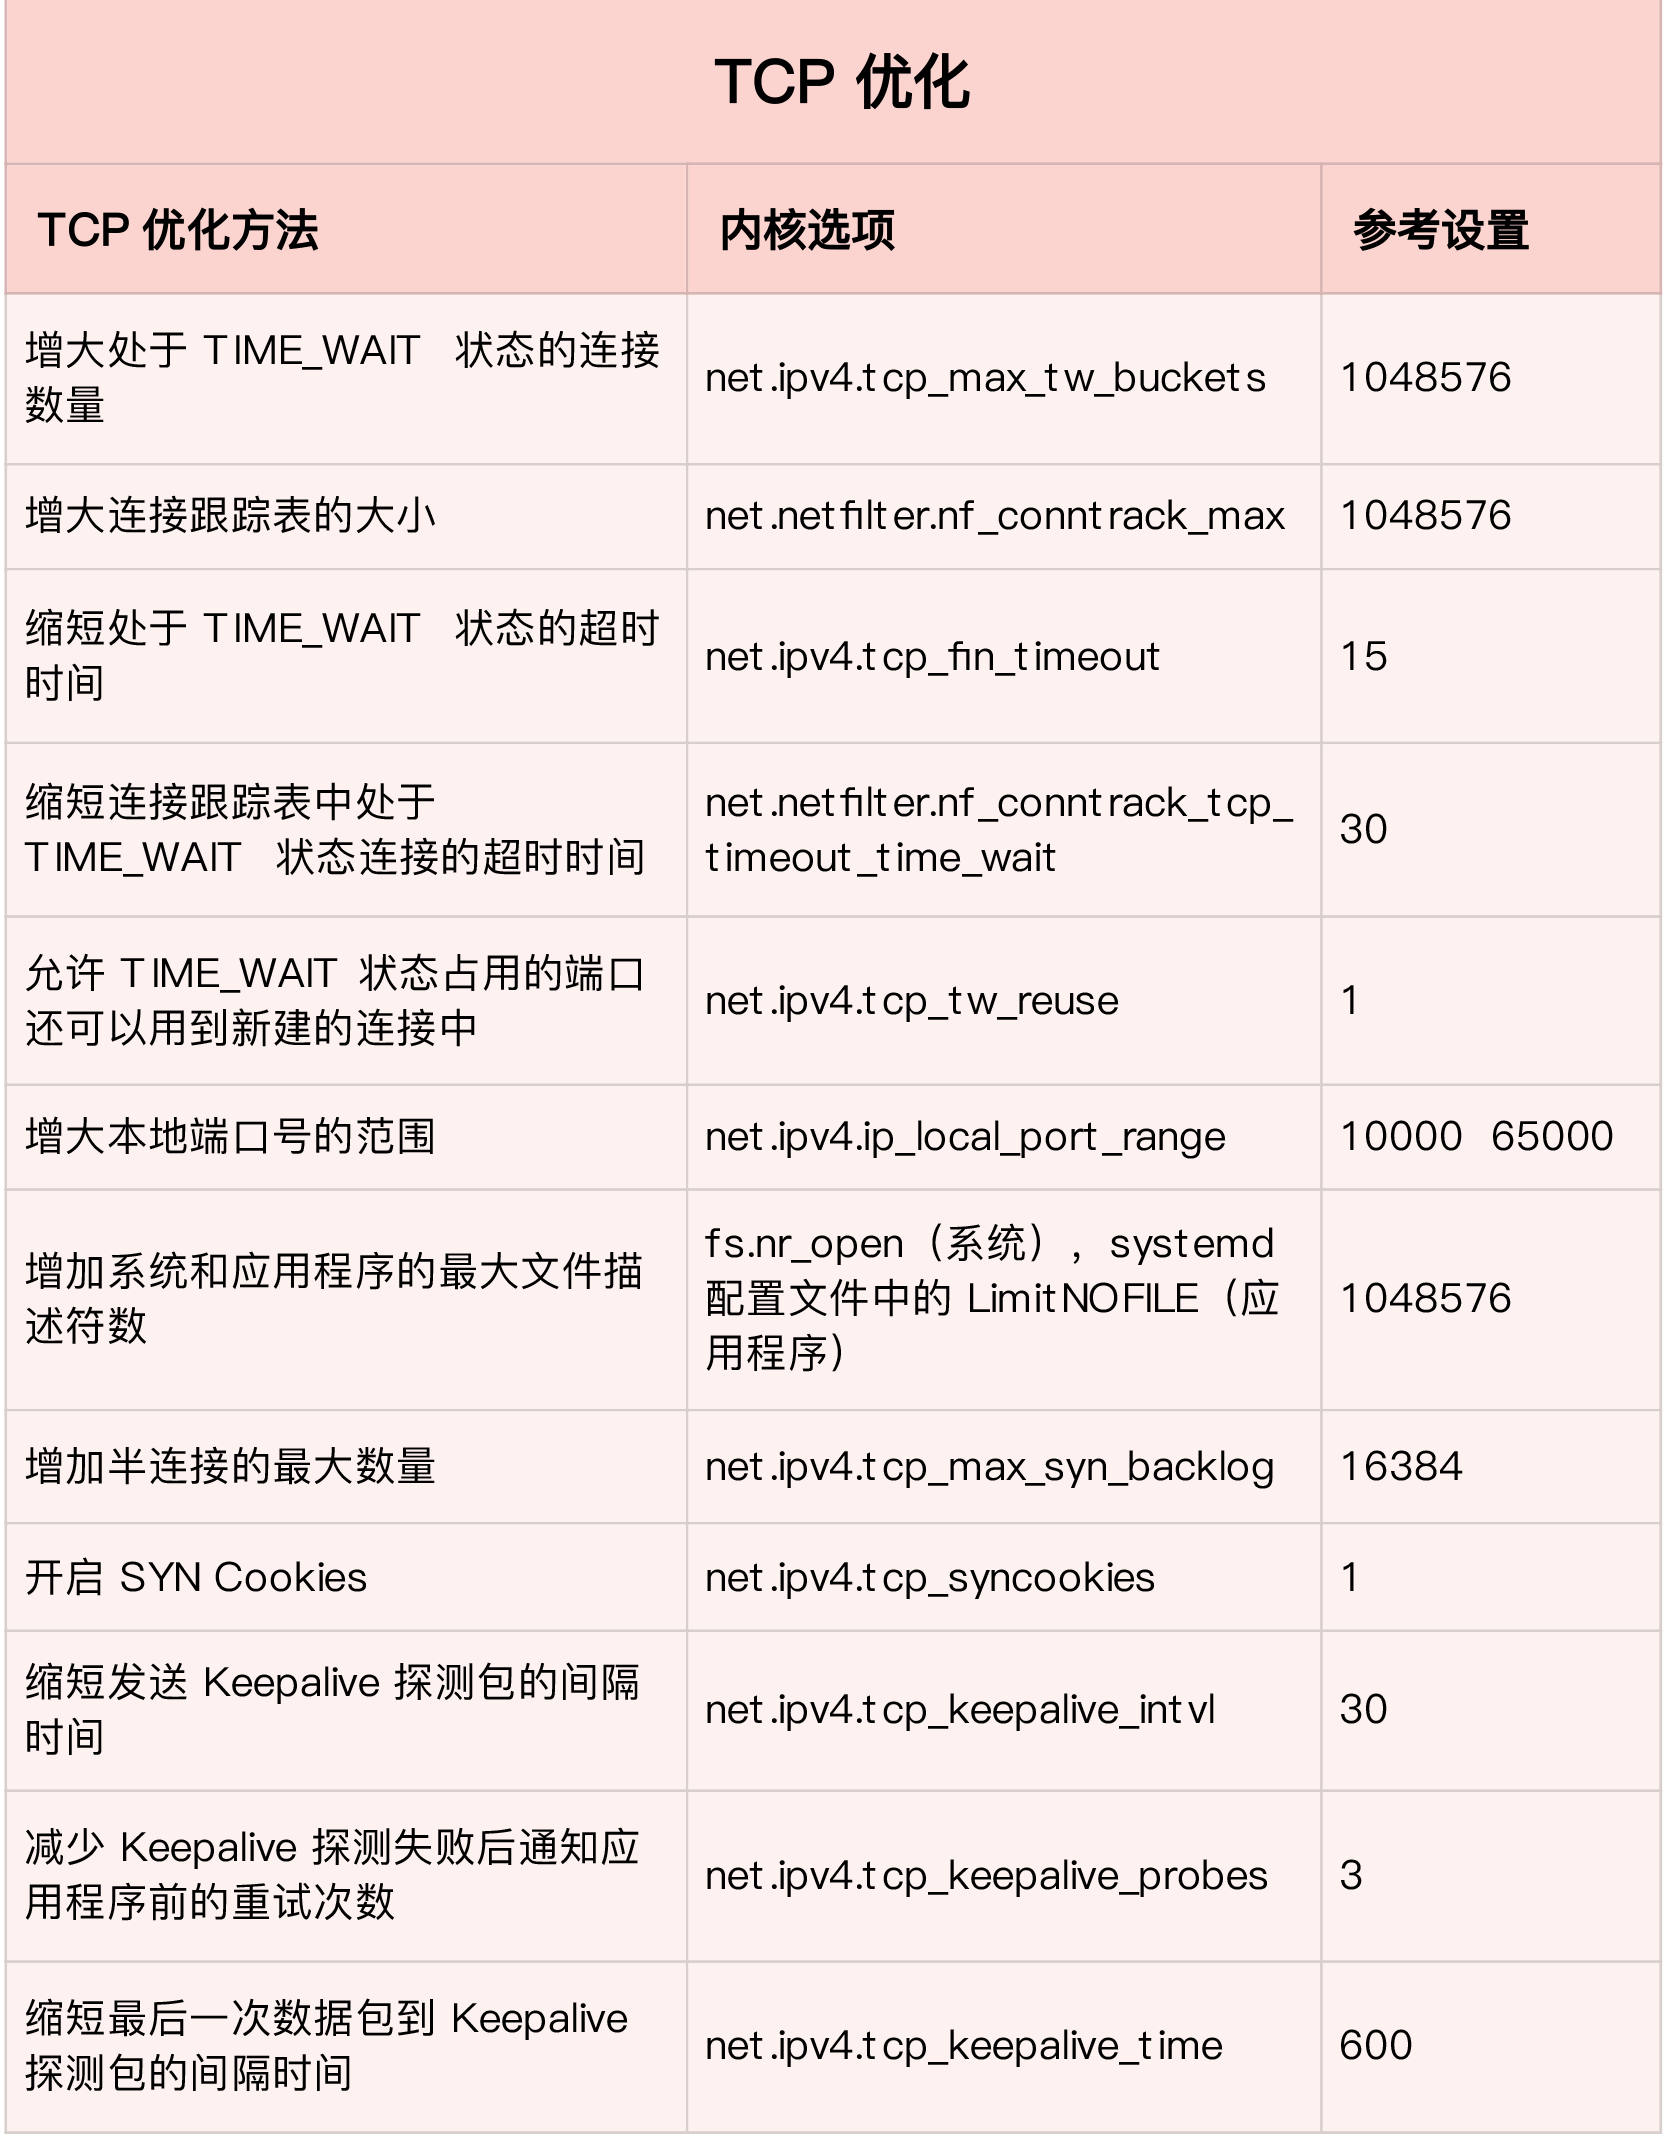
# increase max sysctl -w net.ipv4.tcp_max_syn_backlog=1024 net.ipv4.tcp_max_syn_backlog = 1024
# decrease retry time from default 5 to 1 sysctl -w net.ipv4.tcp_synack_retries=1 net.ipv4.tcp_synack_retries = 1
# enable TCP SYN Cookies sysctl -w net.ipv4.tcp_syncookies=1 net.ipv4.tcp_syncookies = 1
# above set is temporary, for persistent cat /etc/sysctl.conf net.ipv4.tcp_syncookies = 1 net.ipv4.tcp_synack_retries = 1 net.ipv4.tcp_max_syn_backlog = 1024
In a Linux server, you can increase the anti-attack capability of the server and reduce the impact of DDoS on normal services through various methods such as kernel tuning, DPDK, and XDP. In the application, you can use various levels of caching, WAF, CDN and other methods to mitigate the impact of DDoS on the application.
# install wrk git clone https://github.com/wg/wrk cd wrk apt-get install build-essential -y make sudo cp wrk /usr/local/bin/
# create 2 nginx docker run --network=host --name=good -itd nginx
docker run --name nginx --network=host -itd feisky/nginx:latency
# curl port 80 and 8080 # 80 ok curl http://192.168.0.30 <!DOCTYPE html> <html> ... <p><em>Thank you for using nginx.</em></p> </body> </html> # 8080 ok curl http://192.168.0.30:8080 ... <p><em>Thank you for using nginx.</em></p> </body> </html>
# 80 ok hping3 -c 3 -S -p 80 192.168.0.30 HPING 192.168.0.30 (eth0 192.168.0.30): S set, 40 headers + 0 data bytes len=44 ip=192.168.0.30 ttl=64 DF id=0 sport=80 flags=SA seq=0 win=29200 rtt=7.8 ms len=44 ip=192.168.0.30 ttl=64 DF id=0 sport=80 flags=SA seq=1 win=29200 rtt=7.7 ms len=44 ip=192.168.0.30 ttl=64 DF id=0 sport=80 flags=SA seq=2 win=29200 rtt=7.6 ms --- 192.168.0.30 hping statistic --- 3 packets transmitted, 3 packets received, 0% packet loss round-trip min/avg/max = 7.6/7.7/7.8 ms
# 8080 ok hping3 -c 3 -S -p 8080 192.168.0.30 HPING 192.168.0.30 (eth0 192.168.0.30): S set, 40 headers + 0 data bytes len=44 ip=192.168.0.30 ttl=64 DF id=0 sport=8080 flags=SA seq=0 win=29200 rtt=7.7 ms len=44 ip=192.168.0.30 ttl=64 DF id=0 sport=8080 flags=SA seq=1 win=29200 rtt=7.6 ms len=44 ip=192.168.0.30 ttl=64 DF id=0 sport=8080 flags=SA seq=2 win=29200 rtt=7.3 ms --- 192.168.0.30 hping statistic --- 3 packets transmitted, 3 packets received, 0% packet loss round-trip min/avg/max = 7.3/7.6/7.7 ms
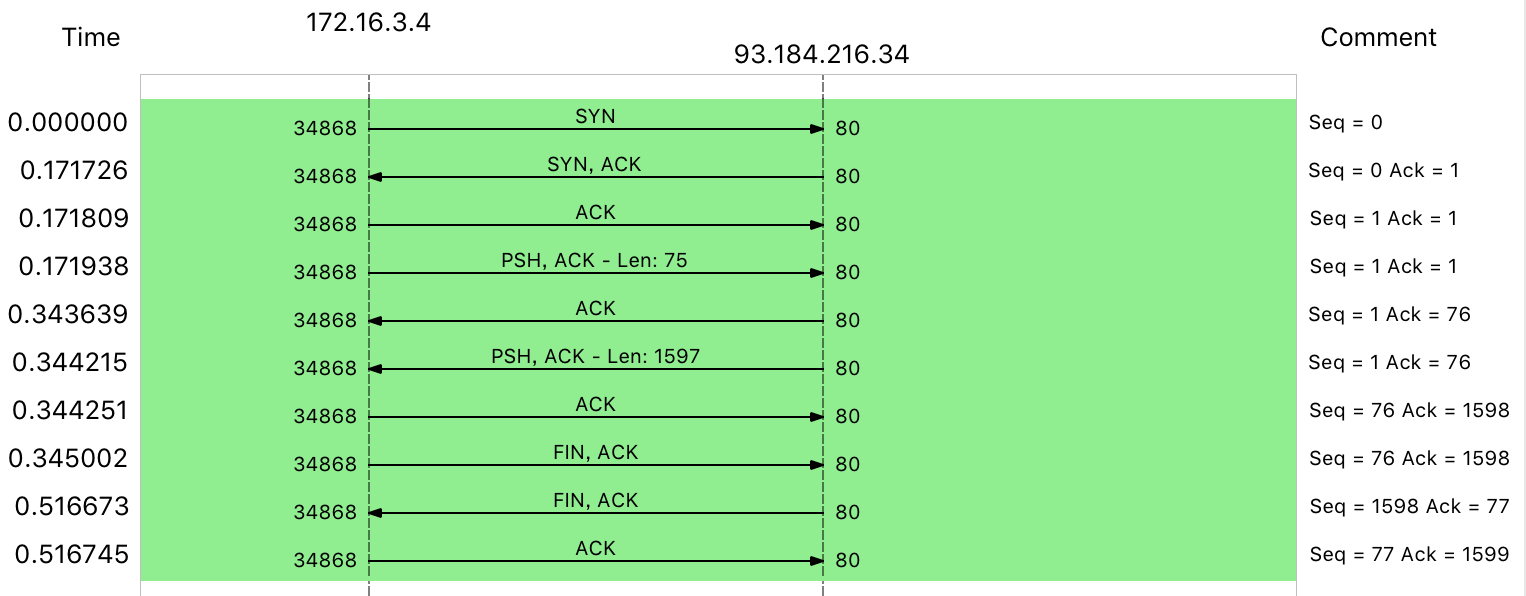
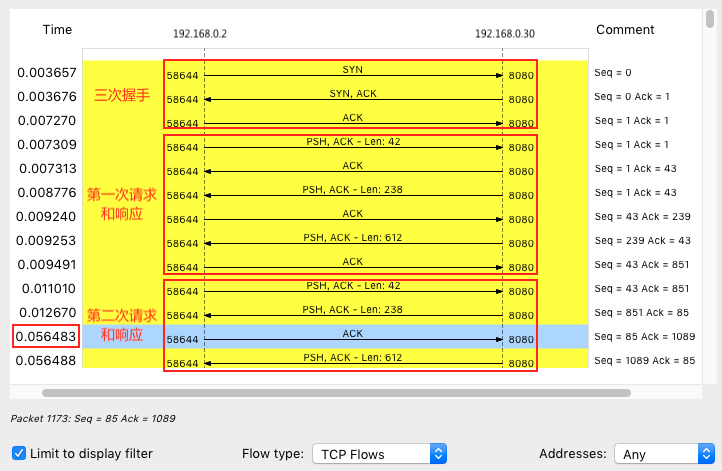
Open this nginx.pcap in Wireshark, Statics -> Flow Graph,select “Limit to display filter” and setup Flow type to “TCP Flows”: Blue area is very slow costs 40ms, 40ms is minimum timeout for TCP delayed acknowledgement (Delayed ACK). An optimization mechanism for TCP ACK, that is, instead of sending an ACK for each request, you wait for a while (such as 40ms). If there are other packets that need to be sent during this period, send them with the ACK. Of course, if you can’t wait for other packets, then send ACK separately after timeout.
1 2 3 4 5 6 7
# TCP_QUICKACK (since Linux 2.4.4) # Enable quickack mode if set or disable quickack mode if cleared. In quickack mode, # acks are sent imme‐diately, rather than delayed if needed in accordance to normal TCP operation. # This flag is not perma‐nent, it only enables a switch to or from quickack mode. # Subsequent operation of the TCP protocol will once again enter/leave quickack mode # depending on internal protocol processing and factors such as delayed ack timeouts occurring # and data transfer. This option should not be used in code intended to be portable.
The Nagle algorithm is an optimization algorithm used in the TCP protocol to reduce the number of small packets sent, in order to improve the utilization of the actual bandwidth. The Nagle algorithm specifies that there can be at most one unconfirmed outstanding packet on a TCP connection; no other packets are sent until an ACK for this packet is received.
1
2
3
4
5
6
7
8
9
10
11
#TCP_NODELAY # If set, disable the Nagle algorithm. This means that segments are always sent as soon as possible, # even if there is only a small amount of data. When not set, data is buffered until there is a # sufficient amount to send out, thereby avoiding the frequent sending of small packets, # which results in poor uti‐lization of the network. # This option is overridden by TCP_CORK; however, setting this option forces an explicit flush of # pending output, even if TCP_CORK is currently set.
ab -c 5000 -n 100000 -r -s 2 http://192.168.0.30/ ... Requests per second: 6576.21 [#/sec] (mean) Time per request: 760.317 [ms] (mean) Time per request: 0.152 [ms] (mean, across all concurrent requests) Transfer rate: 5390.19 [Kbytes/sec] received Connection Times (ms) min mean[+/-sd] median max Connect: 0 177 714.3 9 7338 Processing: 0 27 39.8 19 961 Waiting: 0 23 39.5 16 951 Total: 1 204 716.3 28 7349
# run new test container docker run --name nginx --privileged -p 8080:8080 -itd feisky/nginx:nat
# test again ab -c 5000 -n 100000 -r -s 2 http://192.168.0.30:8080/ ... apr_pollset_poll: The timeout specified has expired (70007) Total of 5602 requests completed
# set timeout is 30s ab -c 5000 -n 10000 -r -s 30 http://192.168.0.30:8080/ ... Requests per second: 76.47 [#/sec] (mean) Time per request: 65380.868 [ms] (mean) Time per request: 13.076 [ms] (mean, across all concurrent requests) Transfer rate: 44.79 [Kbytes/sec] received Connection Times (ms) min mean[+/-sd] median max Connect: 0 1300 5578.0 1 65184 Processing: 0 37916 59283.2 1 130682 Waiting: 0 2 8.7 1 414 Total: 1 39216 58711.6 1021 130682 ...
#! /usr/bin/env stap ############################################################ # Dropwatch.stp # Author: Neil Horman <nhorman@redhat.com> # An example script to mimic the behavior of the dropwatch utility # http://fedorahosted.org/dropwatch ############################################################ # Array to hold the list of drop points we find global locations # Note when we turn the monitor on and off probe begin { printf("Monitoring for dropped packets\n") } probe end { printf("Stopping dropped packet monitor\n") } # increment a drop counter for every location we drop at probe kernel.trace("kfree_skb") { locations[$location] <<< 1 } # Every 5 seconds report our drop locations probe timer.sec(5) { printf("\n") foreach (l in locations-) { printf("%d packets dropped at %s\n", @count(locations[l]), symname(l)) } delete locations }
run this script
1 2 3 4 5 6 7 8 9 10 11 12 13 14 15 16 17
stap --all-modules dropwatch.stp Monitoring for dropped packets
10031 packets dropped at nf_hook_slow 676 packets dropped at tcp_v4_rcv 7284 packets dropped at nf_hook_slow 268 packets dropped at tcp_v4_rcv
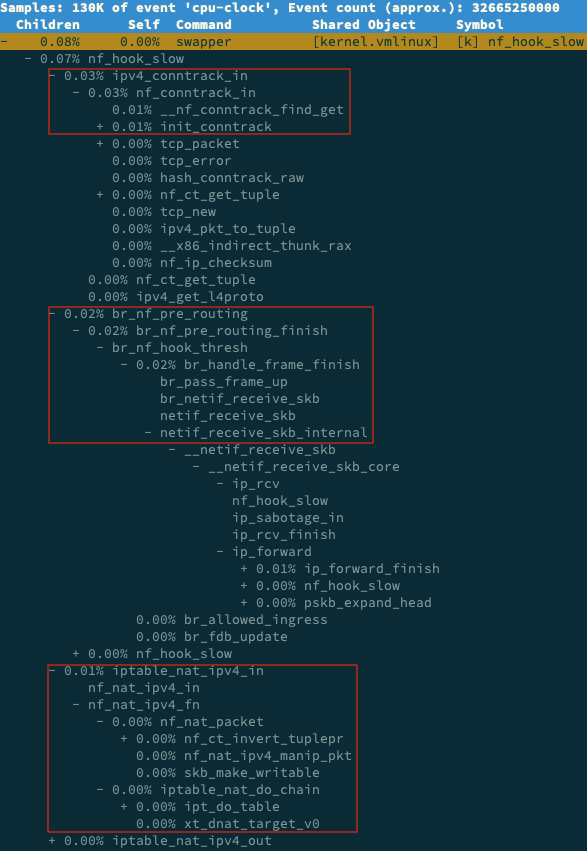
# use perf to check # record 30s crtl + c $ perf record -a -g -- sleep 30 # print report $ perf report -g graph,0
The connection tracking object size is 376, and the list item size is 16 nf_conntrack_max * connection tracking object size + nf_conntrack_buckets * list item size = 1000 * 376 + 65536 * 16 B = 1.4 MB
# test again, now delay is ok ab -c 5000 -n 100000 -r -s 2 http://192.168.0.30:8080/ ... Requests per second: 6315.99 [#/sec] (mean) Time per request: 791.641 [ms] (mean) Time per request: 0.158 [ms] (mean, across all concurrent requests) Transfer rate: 4985.15 [Kbytes/sec] received Connection Times (ms) min mean[+/-sd] median max Connect: 0 355 793.7 29 7352 Processing: 8 311 855.9 51 14481 Waiting: 0 292 851.5 36 14481 Total: 15 666 1216.3 148 14645
After setting TCP_NODELAY for the TCP connection, you can disable the Nagle algorithm;
After TCP_CORK is enabled for a TCP connection, small packets can be aggregated into large packets before being sent (note that it will block the sending of small packets);
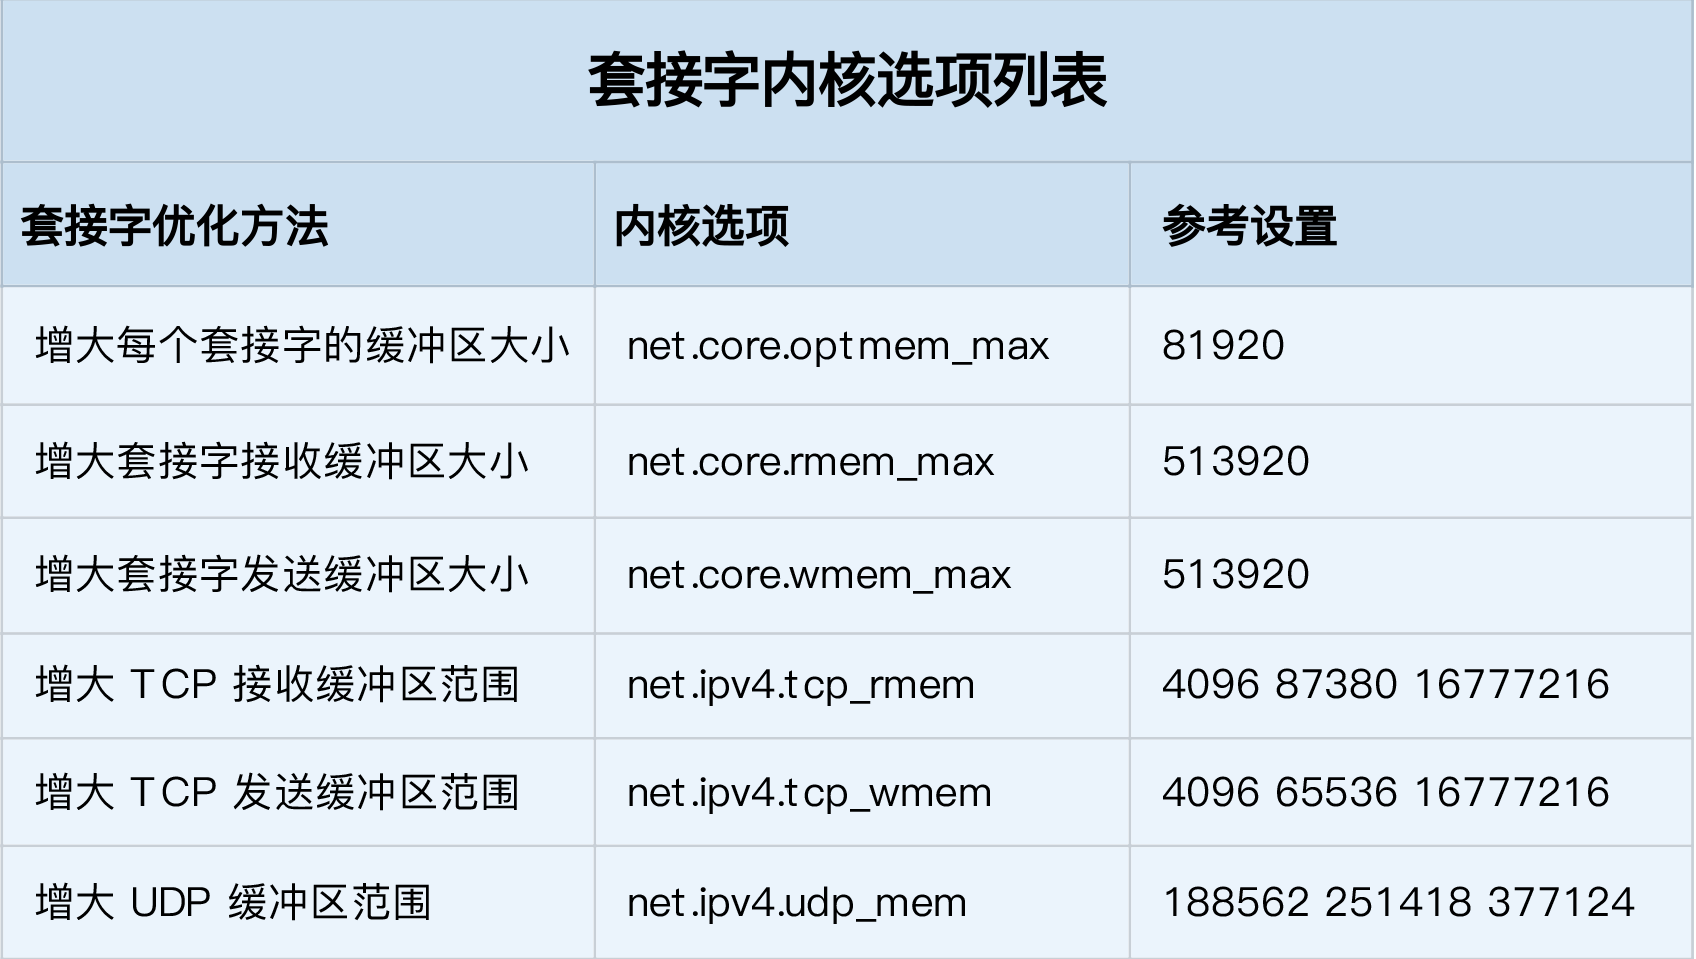
With SO_SNDBUF and SO_RCVBUF, you can adjust the size of the socket send buffer and receive buffer, respectively. The three values of tcp_rmem and tcp_wmem are min, default, and max respectively. The system will automatically adjust the size of the TCP receive / send buffer according to these settings.
The three values of udp_mem are min, pressure, max. The system will automatically adjust the size of the UDP send buffer according to these settings.
During Linux startup, there are three special processes, that is, the three processes with the smallest PID numbers.
Process 0 is an idle process. This is also the first process created by the system. After initializing processes 1 and 2, it becomes an idle task. It runs when no other tasks are executing on the CPU.
Process 1 is the init process, which is usually the systemd process. It runs in user mode and is used to manage other user mode processes.
Process 2 is a kthreadd process, which runs in kernel mode and is used to manage kernel threads.
perf probe --add do_sys_open
Added new event:
  probe:do_sys_open    (on do_sys_open)
You can now use it in all perf tools, such as:
    perf record -e probe:do_sys_open -aR sleep 1


perf probe -V do_sys_open
Available variables at do_sys_open
        @<do_sys_open+0>
                char*   filename
                int     dfd
                int     flags
                struct open_flags     op
                umode_t mode


# delete probe
perf probe --del probe:do_sys_open

perf probe --add 'do_sys_open filename:string'
Added new event:
  probe:do_sys_open    (on do_sys_open with filename:string)
You can now use it in all perf tools, such as:
    perf record -e probe:do_sys_open -aR sleep 1

# run
perf record -e probe:do_sys_open -aR ls
# result
perf script
   perf 13593 [000] 91846.053622: probe:do_sys_open: (ffffffffa807b290) filename_string="/proc/13596/status"
   ls 13596 [000] 91846.053995: probe:do_sys_open: (ffffffffa807b290) filename_string="/etc/ld.so.cache"
   ls 13596 [000] 91846.054011: probe:do_sys_open: (ffffffffa807b290) filename_string="/lib/x86_64-linux-gnu/libselinux.so.1"
   ls 13596 [000] 91846.054066: probe:do_sys_open: (ffffffffa807b290) filename_string="/lib/x86_64-linux-gnu/libc.so.6”
# delete probe before leave perf probe --del probe:do_sys_open
# starce is based on ptrace strace ls ... access("/etc/ld.so.nohwcap", F_OK) = -1 ENOENT (No such file or directory) access("/etc/ld.so.preload", R_OK) = -1 ENOENT (No such file or directory) openat(AT_FDCWD, "/etc/ld.so.cache", O_RDONLY|O_CLOEXEC) = 3 ... access("/etc/ld.so.nohwcap", F_OK) = -1 ENOENT (No such file or directory) openat(AT_FDCWD, "/lib/x86_64-linux-gnu/libselinux.so.1", O_RDONLY|O_CLOEXEC) = 3 ...
netstat -s | grep socket 73 resets received for embryonic SYN_RECV sockets 308582 TCP sockets finished time waitin fast timer 8 delayed acks further delayed because of locked socket 290566 times the listen queue of a socket overflowed 290566 SYNs to LISTEN sockets dropped
ss -ltnp State Recv-Q Send-Q Local Address:Port Peer Address:Port LISTEN 10 10 0.0.0.0:80 0.0.0.0:* users:(("nginx",pid=10491,fd=6),("nginx",pid=10490,fd=6),("nginx",pid=10487,fd=6)) LISTEN 7 10 *:9000 *:* users:(("php-fpm",pid=11084,fd=9),...,("php-fpm",pid=10529,fd=7))
# timewait is still use port, can decrase timewait time or port reuse ss -s TCP: 32775 (estab 1, closed 32768, orphaned 0, synrecv 0, timewait 32768/0), ports 0