# my global config global: scrape_interval:15s# Set the scrape interval to every 15 seconds. Default is every 1 minute. evaluation_interval:15s# Evaluate rules every 15 seconds. The default is every 1 minute. # scrape_timeout is set to the global default (10s).
# Load rules once and periodically evaluate them according to the global 'evaluation_interval'. rule_files: # - "first_rules.yml" # - "second_rules.yml"
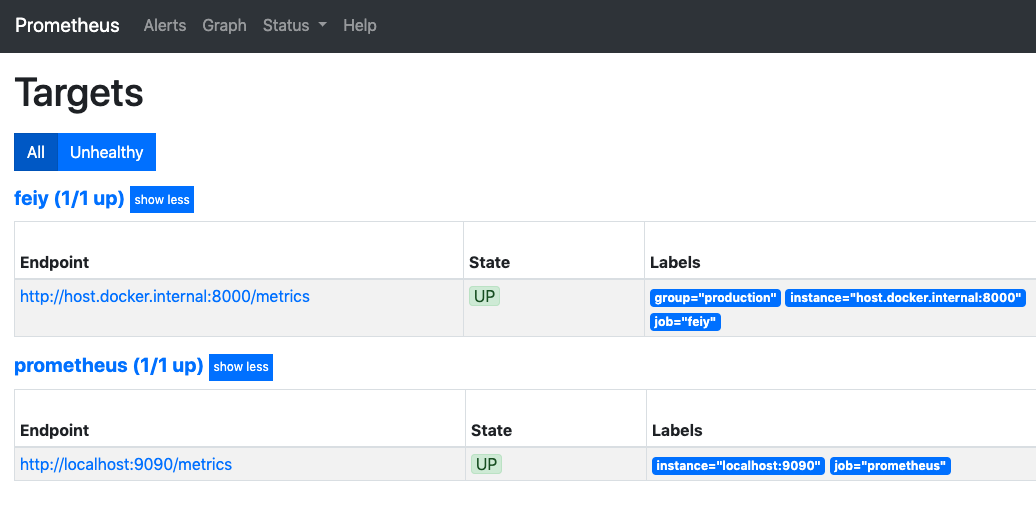
# A scrape configuration containing exactly one endpoint to scrape: # Here it's Prometheus itself. scrape_configs: # The job name is added as a label `job=<job_name>` to any timeseries scraped from this config. -job_name:'prometheus'
# metrics_path defaults to '/metrics' # scheme defaults to 'http'.
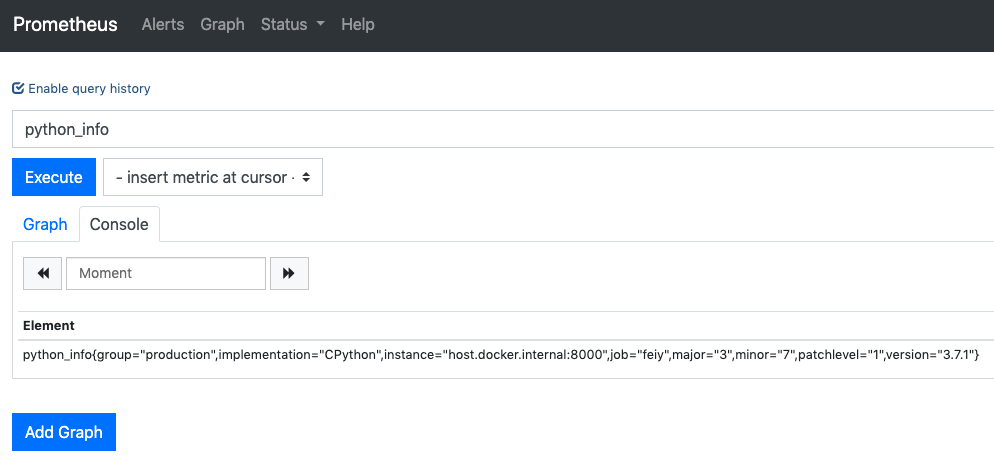
# HELP python_gc_objects_collected_total Objects collected during gc # TYPE python_gc_objects_collected_total counter python_gc_objects_collected_total{generation="0"} 17999.0 python_gc_objects_collected_total{generation="1"} 2384.0 python_gc_objects_collected_total{generation="2"} 833.0 # HELP python_gc_objects_uncollectable_total Uncollectable object found during GC # TYPE python_gc_objects_uncollectable_total counter python_gc_objects_uncollectable_total{generation="0"} 0.0 python_gc_objects_uncollectable_total{generation="1"} 0.0 python_gc_objects_uncollectable_total{generation="2"} 0.0 # HELP python_gc_collections_total Number of times this generation was collected # TYPE python_gc_collections_total counter python_gc_collections_total{generation="0"} 255.0 python_gc_collections_total{generation="1"} 23.0 python_gc_collections_total{generation="2"} 2.0 # HELP python_info Python platform information # TYPE python_info gauge python_info{implementation="CPython",major="3",minor="7",patchlevel="1",version="3.7.1"} 1.0 # HELP request_processing_seconds Time spent processing request # TYPE request_processing_seconds summary request_processing_seconds_count{endpoint="/metrics/",method="GET",status_code="200"} 3.0 request_processing_seconds_sum{endpoint="/metrics/",method="GET",status_code="200"} 0.0 # TYPE request_processing_seconds_created gauge request_processing_seconds_created{endpoint="/metrics/",method="GET",status_code="200"} 1.570089497964517e+09 # HELP request_byte_sum_total Total request byte sum # TYPE request_byte_sum_total counter request_byte_sum_total{endpoint="/metrics/",method="GET",status_code="200"} 0.0 # TYPE request_byte_sum_created gauge request_byte_sum_created{endpoint="/metrics/",method="GET",status_code="200"} 1.570089497964633e+09 # HELP response_byte_sum_total Total response byte sum # TYPE response_byte_sum_total counter response_byte_sum_total{endpoint="/metrics/",method="GET",status_code="200"} 5533.0 # TYPE response_byte_sum_created gauge response_byte_sum_created{endpoint="/metrics/",method="GET",status_code="200"} 1.5700894979645782e+09