都 2021 年了,我终于把 kubernetes 实验测试环境搭建好了,泪目
2019 年的时候,我也曾经尝试学习,搭建 kubernetes 集群,结果当时自己的电脑性能太差了。一台 mac 模拟出三台虚拟机,性能上根本无法满足要求,甚至偶尔死机。还有当时自己 naive, 也不会善用快照 , 每次搞崩溃了环境,又重头再来,费时费力。
如今,时代变了。兵强马壮,家里有三台笔记本,一台台式机,机荒的日子已经一去不复返了。重现当年好学的荣光,我辈义不容辞,冲。
概要 本文记录了,在三台 Ubuntu 虚拟机上搭建一个 kubernetes 集群的全部过程,以及分享菜鸡我踩过的坑。
实验的环境如下, 都是 Ubuntu desktop 桌面版的,我也建议用桌面版。 原因:比如 kubernetes Dashboard 只能从 localhost 本地访问,桌面版自带 Firefox 浏览器,就可以直接在虚拟机界面里面直接操作, 少一步转发。
Name
Operating system
Kernel
CPU
RAM
Disk
IP
ubuntu18-119
Ubuntu 18.04.5 LTS
5.4.0
2
4G
30G
192.168.1.119
ubuntu18-120
Ubuntu 18.04.5 LTS
5.4.0
2
4G
30G
192.168.1.120
ubuntu18-121
Ubuntu 18.04.5 LTS
5.4.0
2
4G
30G
192.168.1.121
这三台虚拟机,分别跑在三台笔记本电脑上。这样做的好处是,桥接模式不需要 NAT 端口映射,在我家的局域网里面尽情的玩耍。
实验环境的搭建,可以参考我的另外一篇博客 https://feiyang233.club/post/vm/
搭建集群 分享两个不错的参考文档:
准备工作 在每一台机器上面做相同的准备工作。
硬件要求
每台机器 2 GB 或更多的 RAM
2 CPU 核或更多
集群中的所有机器的网络彼此均能相互连接
节点之中不可以有重复的主机名、MAC 地址或 product_uuid
1
2
你可以使用命令 ip link 或 ifconfig -a 来获取网络接口的 MAC 地址 可以使用 sudo cat /sys/class/dmi/id/product_uuid 命令对 product_uuid 校验
禁用交换分区。 删除文件 /etc/fstab 中 swapfile 一行
1 2 3 4 5 6 7 8 9 10 11 UUID=2bd16ba3-1087-4d5e-9d1b-f1527f62a3ce / ext4 errors=remount-ro 0 1 /dev/fd0 /media/floppy0 auto rw,user,noauto,exec ,utf8 0 0
允许 iptables 检查桥接流量
1
2
3
4
root@ubuntu18-121:~ br_netfilter 28672 0 bridge 176128 1 br_netfilter root@ubuntu18-121:~
禁用默认的防火墙服务, Ubuntu和Debian等Linux发行版默认使用ufw(Uncomplicated FireWall)作为前端来简化 iptables的使用
安装 docker 参考官网文档
1 2 3 4 5 6 7 8 9 10 11 12 13 14 15 16 17 18 sudo apt-get update sudo apt-get install \ apt-transport-https \ ca-certificates \ curl \ gnupg \ lsb-release curl -fsSL https://download.docker.com/linux/ubuntu/gpg | sudo gpg --dearmor -o /usr/share/keyrings/docker-archive-keyring.gpg echo \ "deb [arch=amd64 signed-by=/usr/share/keyrings/docker-archive-keyring.gpg] https://download.docker.com/linux/ubuntu \ $(lsb_release -cs) stable" | sudo tee /etc/apt/sources.list.d/docker.list > /dev/nullsudo apt-get update sudo apt-get install docker-ce docker-ce-cli containerd.io
Container runtimes 配置 Docker 守护程序,尤其是使用 systemd 来管理容器的 cgroup。https://kubernetes.io/zh/docs/setup/production-environment/container-runtimes/#docker
1 2 3 4 5 6 7 8 9 10 11 12 13 14 15 cat <<EOF | sudo tee /etc/docker/daemon.json { "exec-opts": ["native.cgroupdriver=systemd"], "log-driver": "json-file", "log-opts": { "max-size": "100m" }, "storage-driver": "overlay2" } EOF sudo systemctl enable docker sudo systemctl daemon-reload sudo systemctl restart docker
设置集群 在三台机器上面安装 kubelet kubeadm kubectl,我当时安装的版本是 v1.21.1
1 2 3 4 5 6 7 8 9 10 11 12 sudo apt-get update && sudo apt-get install -y apt-transport-https gnupg2 curl curl -s https://packages.cloud.google.com/apt/doc/apt-key.gpg | sudo apt-key add - echo "deb https://apt.kubernetes.io/ kubernetes-xenial main" | sudo tee -a /etc/apt/sources.list.d/kubernetes.listsudo apt-get update sudo apt-get install -y kubelet kubeadm kubectl kubeadm config images pull
到这来就可以先把三台机器关机,然后备份,存快照 snapshot
master 初始化master节点,kubeadm init命令支持两种初始化方式,一是通过命令行选项传递关键的部署设定,另一个是基于yaml格式的专用配置文件,后一种允许用户自定义各个部署参数。
命令中的各选项简单说明如下:
–pod-network-cidr:Pod网络的地址范围,其值为CIDR格式的网络地址,通常,Flannel网络插件的默认为10.244.0.0/16,Project Calico插件的默认值为192.168.0.0/16;
–service-cidr:Service的网络地址范围,其值为CIDR格式的网络地址,默认为10.96.0.0/12;通常,仅Flannel一类的网络插件需要手动指定该地址;
–apiserver-advertise-address:apiserver通告给其他组件的IP地址,一般应该为Master节点的用于集群内部通信的IP地址,0.0.0.0表示节点上所有可用地址;
–token-ttl:共享令牌(token)的过期时长,默认为24小时,0表示永不过期;为防止不安全存储等原因导致的令牌泄露危及集群安全,建议为其设定过期时长。未设定该选项时,在token过期后,若期望再向集群中加入其它节点,可以使用如下命令重新创建token,并生成节点加入命令。
1 2 3 4 5 6 7 8 9 10 11 12 13 14 15 16 17 18 19 20 21 22 23 24 25 26 27 28 29 30 31 32 33 34 35 36 37 38 39 40 41 42 43 44 45 46 47 sudo kubeadm init \ --apiserver-advertise-address=192.168.1.119 \ --pod-network-cidr=10.244.0.0/16 \ --service-cidr=10.245.0.0/16 Your Kubernetes control-plane has initialized successfully! To start using your cluster, you need to run the following as a regular user: mkdir -p $HOME /.kube sudo cp -i /etc/kubernetes/admin.conf $HOME /.kube/config sudo chown $(id -u):$(id -g) $HOME /.kube/config Alternatively, if you are the root user, you can run: export KUBECONFIG=/etc/kubernetes/admin.conf You should now deploy a pod network to the cluster. Run "kubectl apply -f [podnetwork].yaml" with one of the options listed at: https://kubernetes.io/docs/concepts/cluster-administration/addons/ Then you can join any number of worker nodes by running the following on each as root: kubeadm join 192.168.1.119:6443 --token vldwrp.5p31pom71n355r2k \ --discovery-token-ca-cert-hash sha256:b8a5fd92b8506651a6b7a23d9176eeb4c66c8ff92a5d59ea0a5e084d494ae64f mkdir -p $HOME /.kubesudo cp -i /etc/kubernetes/admin.conf $HOME /.kube/config sudo chown $(id -u):$(id -g) $HOME /.kube/config export KUBECONFIG=/etc/kubernetes/admin.confkubectl get pods --all-namespaces NAMESPACE NAME READY STATUS RESTARTS AGE kube-system coredns-558bd4d5db-76fbb 0/1 Pending 0 64s kube-system coredns-558bd4d5db-vpjf4 0/1 Pending 0 64s kube-system etcd-ubuntu18-119 1/1 Running 0 79s kube-system kube-apiserver-ubuntu18-119 1/1 Running 0 79s kube-system kube-controller-manager-ubuntu18-119 1/1 Running 0 71s kube-system kube-proxy-k8xth 1/1 Running 0 64s kube-system kube-scheduler-ubuntu18-119 1/1 Running 0 71s
还有非常重要的一步是 部署网络插件, 插件列表 , 这里我们选择安装 Flannel
1 2 3 4 5 6 7 8 9 10 kubectl apply -f https://raw.githubusercontent.com/coreos/flannel/master/Documentation/kube-flannel.yml Warning: policy/v1beta1 PodSecurityPolicy is deprecated in v1.21+, unavailable in v1.25+ podsecuritypolicy.policy/psp.flannel.unprivileged created clusterrole.rbac.authorization.k8s.io/flannel created clusterrolebinding.rbac.authorization.k8s.io/flannel created serviceaccount/flannel created configmap/kube-flannel-cfg created daemonset.apps/kube-flannel-ds created
安装完成,再检查 pods
1 2 3 4 5 6 7 8 9 10 11 12 13 14 15 16 17 18 19 20 21 22 23 24 kubectl get pods -n kube-system -l app=flannel NAME READY STATUS RESTARTS AGE kube-flannel-ds-bj57z 1/1 Running 0 17s kubectl get pods -n kube-system NAME READY STATUS RESTARTS AGE coredns-558bd4d5db-76fbb 1/1 Running 0 10h coredns-558bd4d5db-vpjf4 1/1 Running 0 10h etcd-ubuntu18-119 1/1 Running 0 10h kube-apiserver-ubuntu18-119 1/1 Running 0 10h kube-controller-manager-ubuntu18-119 1/1 Running 0 10h kube-flannel-ds-89pc6 1/1 Running 0 10h kube-flannel-ds-bj57z 1/1 Running 0 10h kube-flannel-ds-pnw6c 1/1 Running 0 10h kube-proxy-k8xth 1/1 Running 0 10h kube-proxy-n8fj8 1/1 Running 0 10h kube-proxy-wlfmr 1/1 Running 0 10h kube-scheduler-ubuntu18-119 1/1 Running 0 10h kubectl get nodes NAME STATUS ROLES AGE VERSION ubuntu18-119 Ready control-plane,master 3m29s v1.21.1
以上终于完成了主要节点的设置,接下来是其余 2 个节点的加入。
node1 1 2 3 4 5 6 7 8 9 10 11 12 13 14 15 16 kubeadm join 192.168.1.119:6443 --token vldwrp.5p31pom71n355r2k \ --discovery-token-ca-cert-hash sha256:b8a5fd92b8506651a6b7a23d9176eeb4c66c8ff92a5d59ea0a5e084d494ae64f [preflight] Running pre-flight checks [preflight] Reading configuration from the cluster... [preflight] FYI: You can look at this config file with 'kubectl -n kube-system get cm kubeadm-config -o yaml' [kubelet-start] Writing kubelet configuration to file "/var/lib/kubelet/config.yaml" [kubelet-start] Writing kubelet environment file with flags to file "/var/lib/kubelet/kubeadm-flags.env" [kubelet-start] Starting the kubelet [kubelet-start] Waiting for the kubelet to perform the TLS Bootstrap... This node has joined the cluster: * Certificate signing request was sent to apiserver and a response was received. * The Kubelet was informed of the new secure connection details. Run 'kubectl get nodes' on the control-plane to see this node join the cluster.
node2 1 2 3 4 5 6 7 8 9 10 11 12 13 14 15 16 kubeadm join 192.168.1.119:6443 --token vldwrp.5p31pom71n355r2k \ --discovery-token-ca-cert-hash sha256:b8a5fd92b8506651a6b7a23d9176eeb4c66c8ff92a5d59ea0a5e084d494ae64f [preflight] Running pre-flight checks [preflight] Reading configuration from the cluster... [preflight] FYI: You can look at this config file with 'kubectl -n kube-system get cm kubeadm-config -o yaml' [kubelet-start] Writing kubelet configuration to file "/var/lib/kubelet/config.yaml" [kubelet-start] Writing kubelet environment file with flags to file "/var/lib/kubelet/kubeadm-flags.env" [kubelet-start] Starting the kubelet [kubelet-start] Waiting for the kubelet to perform the TLS Bootstrap... This node has joined the cluster: * Certificate signing request was sent to apiserver and a response was received. * The Kubelet was informed of the new secure connection details. Run 'kubectl get nodes' on the control-plane to see this node join the cluster.
测试 当 2 个节点成功加入集群后,我们可以在 master 节点检查 nodes 情况, 3 个 nodes 的情况
1 2 3 4 5 6 kubectl get nodes -o wide NAME STATUS ROLES AGE VERSION INTERNAL-IP EXTERNAL-IP OS-IMAGE KERNEL-VERSION CONTAINER-RUNTIME ubuntu18-119 Ready control-plane,master 10h v1.21.1 192.168.1.119 <none> Ubuntu 18.04.5 LTS 5.4.0-72-generic docker://20.10.6 ubuntu18-120 Ready <none> 10h v1.21.1 192.168.1.120 <none> Ubuntu 18.04.5 LTS 5.4.0-42-generic docker://20.10.6 ubuntu18-121 Ready <none> 10h v1.21.1 192.168.1.121 <none> Ubuntu 18.04.5 LTS 5.4.0-42-generic docker://20.10.6
到此为止,一个master,并附带有三个node的kubernetes集群基础设施已经部署完成,用户随后即可测试其核心功能。例如,下面的命令可将demoapp以Pod的形式编排运行于集群之上,并通过在集群外部进行访问
1 2 3 4 5 6 7 8 9 10 11 12 13 14 15 16 17 18 19 20 21 22 23 24 25 26 27 28 29 30 31 32 33 34 35 36 37 38 39 40 41 42 43 44 45 46 47 48 49 50 51 52 53 54 55 56 57 58 59 60 61 62 63 64 65 66 67 68 kubectl create deployment demoapp --image=ikubernetes/demoapp:v1.0 kubectl scale deployment/demoapp --replicas=6 kubectl create service nodeport demoapp --tcp=80:80 kubectl get svc -l app=demoapp NAME TYPE CLUSTER-IP EXTERNAL-IP PORT(S) AGE demoapp NodePort 10.245.33.169 <none> 80:31938/TCP 6s kubectl get pods -o wide NAME READY STATUS RESTARTS AGE IP NODE NOMINATED NODE READINESS GATES demoapp-5f7d8f9847-2s6zd 1/1 Running 0 57s 10.244.2.2 ubuntu18-121 <none> <none> demoapp-5f7d8f9847-2wqdv 1/1 Running 0 57s 10.244.1.4 ubuntu18-120 <none> <none> demoapp-5f7d8f9847-8p7wd 1/1 Running 0 57s 10.244.1.3 ubuntu18-120 <none> <none> demoapp-5f7d8f9847-jrmzj 1/1 Running 0 81s 10.244.1.2 ubuntu18-120 <none> <none> demoapp-5f7d8f9847-mjk7x 1/1 Running 0 57s 10.244.1.5 ubuntu18-120 <none> <none> demoapp-5f7d8f9847-xch2b 1/1 Running 0 57s 10.244.1.6 ubuntu18-120 <none> <none> kubectl describe svc demoapp Name: demoapp Namespace: default Labels: app=demoapp Annotations: <none> Selector: app=demoapp Type: NodePort IP Family Policy: SingleStack IP Families: IPv4 IP: 10.245.33.169 IPs: 10.245.33.169 Port: 80-80 80/TCP TargetPort: 80/TCP NodePort: 80-80 31938/TCP Endpoints: 10.244.1.44:80,10.244.1.45:80,10.244.1.46:80 + 3 more... Session Affinity: None External Traffic Policy: Cluster Events: <none> curl http://10.245.33.169 iKubernetes demoapp v1.0 !! ClientIP: 10.244.0.0, ServerName: demoapp-5f7d8f9847-pps49, ServerIP: 10.244.1.49! curl http://10.245.33.169 iKubernetes demoapp v1.0 !! ClientIP: 10.244.0.0, ServerName: demoapp-5f7d8f9847-p7vdc, ServerIP: 10.244.1.48! curl http://10.245.33.169 iKubernetes demoapp v1.0 !! ClientIP: 10.244.0.0, ServerName: demoapp-5f7d8f9847-2z5g4, ServerIP: 10.244.1.44! curl http://192.168.1.119:31938 iKubernetes demoapp v1.0 !! ClientIP: 10.244.0.0, ServerName: demoapp-5f7d8f9847-2s6zd, ServerIP: 10.244.2.2! curl http://192.168.1.120:31938 iKubernetes demoapp v1.0 !! ClientIP: 10.244.1.1, ServerName: demoapp-5f7d8f9847-2wqdv, ServerIP: 10.244.1.4! curl http://192.168.1.121:31938 iKubernetes demoapp v1.0 !! ClientIP: 10.244.2.0, ServerName: demoapp-5f7d8f9847-xch2b, ServerIP: 10.244.1.6!
demoapp是一个web应用,k8s 内部可以通过 service_ip + port “http://10.245.33.169:80 “ 访问。 集群外部可以通过 “http://NodeIP:31938 “ 这个URL访问demoapp上的应用,例如于集群外通过浏览器访问”http://192.168.1.119:31938 “ 。 当然用 Nginx 做一层代理也是可以的, 或者云上的话,就是 load balancer
注意 Service IP 10.245.33.169 完全是虚拟的,它从来没有走过网络,如果对它如何工作的原理感到好奇, 可以进一步阅读 服务代理 的内容。
service forward
service virtual ip: 10.245.33.169 port:80
node_ip: 192.168.1.x port:31938
请先看一下这篇文章 理解kubernetes环境的iptables
1 2 3 4 5 6 7 8 9 10 11 12 13 14 15 16 17 18 19 20 21 22 23 24 # nat 表里面的转发规则 ,关于 destination 是 虚拟 ip 的有两条规则 iptables -t nat -L KUBE-SERVICES -n | grep 10.245.33.169 KUBE-MARK-MASQ tcp -- !10.244.0.0/16 10.245.33.169 /* default/demoapp:80-80 cluster IP */ tcp dpt:80 KUBE-SVC-EGFVCLHG4JMRSQGG tcp -- 0.0.0.0/0 10.245.33.169 /* default/demoapp:80-80 cluster IP */ tcp dpt:80 # 6 个 pods ,注意 IP 地址 kubectl get pods -o wide NAME READY STATUS RESTARTS AGE IP NODE NOMINATED NODE READINESS GATES demoapp-5f7d8f9847-2z5g4 1/1 Running 0 5d17h 10.244.1.44 ubuntu18-120 <none> <none> demoapp-5f7d8f9847-dq6s9 1/1 Running 0 5d17h 10.244.1.47 ubuntu18-120 <none> <none> demoapp-5f7d8f9847-p7vdc 1/1 Running 0 5d17h 10.244.1.48 ubuntu18-120 <none> <none> demoapp-5f7d8f9847-pps49 1/1 Running 0 5d17h 10.244.1.49 ubuntu18-120 <none> <none> demoapp-5f7d8f9847-t6c8k 1/1 Running 0 5d17h 10.244.1.46 ubuntu18-120 <none> <none> demoapp-5f7d8f9847-wjqmm 1/1 Running 0 5d17h 10.244.1.45 ubuntu18-120 <none> <none> # 每个 pods 都有一条规则, 如果有请求是访问 pods 的 iptables -t nat -L -n | grep 10.244.1 KUBE-MARK-MASQ all -- 10.244.1.49 0.0.0.0/0 /* default/demoapp:80-80 */ KUBE-MARK-MASQ all -- 10.244.1.47 0.0.0.0/0 /* default/demoapp:80-80 */ KUBE-MARK-MASQ all -- 10.244.1.44 0.0.0.0/0 /* default/demoapp:80-80 */ KUBE-MARK-MASQ all -- 10.244.1.48 0.0.0.0/0 /* default/demoapp:80-80 */ KUBE-MARK-MASQ all -- 10.244.1.46 0.0.0.0/0 /* default/demoapp:80-80 */ KUBE-MARK-MASQ all -- 10.244.1.45 0.0.0.0/0 /* default/demoapp:80-80 */
从上面可以看到, iptable 最终进入到 KUBE-MARK-MASQ chain 链, 而最终会 mark 标记后的请求由 kube-proxy 处理
1 2 3 Chain KUBE-MARK-MASQ (23 references) target prot opt source destination MARK all -- 0.0.0.0/0 0.0.0.0/0 MARK or 0x4000
iptables proxy 检查是哪一种 proxy mode How to find which mode kube-proxy is running in
1 2 3 4 5 6 7 8 9 10 11 12 13 14 15 16 17 root@ubuntu18-119:~ I0601 06:59:18.494352 1 node.go:172] Successfully retrieved node IP: 192.168.1.119 I0601 06:59:18.494404 1 server_others.go:140] Detected node IP 192.168.1.119 W0601 06:59:18.494436 1 server_others.go:598] Unknown proxy mode "" , assuming iptables proxy I0601 06:59:18.617259 1 server_others.go:206] kube-proxy running in dual-stack mode, IPv4-primary I0601 06:59:18.617285 1 server_others.go:212] Using iptables Proxier. I0601 06:59:18.617295 1 server_others.go:219] creating dualStackProxier for iptables. W0601 06:59:18.617306 1 server_others.go:512] detect-local-mode set to ClusterCIDR, but no IPv6 cluster CIDR defined, , defaulting to no-op detect-local for IPv6 I0601 06:59:18.620918 1 server.go:643] Version: v1.21.1 I0601 06:59:18.623937 1 conntrack.go:100] Set sysctl 'net/netfilter/nf_conntrack_max' to 131072 I0601 06:59:18.623965 1 conntrack.go:52] Setting nf_conntrack_max to 131072 I0601 06:59:18.624646 1 conntrack.go:83] Setting conntrack hashsize to 32768 I0601 06:59:18.641659 1 conntrack.go:100] Set sysctl 'net/netfilter/nf_conntrack_tcp_timeout_established' to 86400 I0601 06:59:18.641709 1 conntrack.go:100] Set sysctl 'net/netfilter/nf_conntrack_tcp_timeout_close_wait' to 3600 I0601 06:59:18.647124 1 config.go:315] Starting service config controller I0601 06:59:18.648113 1 shared_informer.go:240] Waiting for caches to sync for service config I0601 06:59:18.648459 1 config.go:224] Starting endpoint slice config controller
有两幅图很生动,第一幅是从宏观上,第二幅是从微观上 iptable chain 过程
看完第二幅图,以我们自己的实验环境举例子,结果如下
1 2 3 4 5 6 7 8 9 10 11 12 13 14 15 16 17 18 19 20 KUBE-SVC-EGFVCLHG4JMRSQGG tcp -- 0.0.0.0/0 10.245.33.169 /* default/demoapp:80-80 cluster IP */ tcp dpt:80 iptables -t nat -L KUBE-SVC-EGFVCLHG4JMRSQGG -n Chain KUBE-SVC-EGFVCLHG4JMRSQGG (2 references) target prot opt source destination KUBE-SEP-LFNE4UIW5JTX3DLE all -- 0.0.0.0/0 0.0.0.0/0 /* default/demoapp:80-80 */ statistic mode random probability 0.16666666651 KUBE-SEP-VKI6CD7L7QDWV7PR all -- 0.0.0.0/0 0.0.0.0/0 /* default/demoapp:80-80 */ statistic mode random probability 0.20000000019 KUBE-SEP-ONGVKLAWWHRT2JYZ all -- 0.0.0.0/0 0.0.0.0/0 /* default/demoapp:80-80 */ statistic mode random probability 0.25000000000 KUBE-SEP-BWUFDZ7V66HHLROZ all -- 0.0.0.0/0 0.0.0.0/0 /* default/demoapp:80-80 */ statistic mode random probability 0.33333333349 KUBE-SEP-NQEYALZIWTXZ4WPY all -- 0.0.0.0/0 0.0.0.0/0 /* default/demoapp:80-80 */ statistic mode random probability 0.50000000000 KUBE-SEP-36MBDHMST2HAATHB all -- 0.0.0.0/0 0.0.0.0/0 /* default/demoapp:80-80 */ iptables -t nat -L KUBE-SEP-36MBDHMST2HAATHB -n Chain KUBE-SEP-36MBDHMST2HAATHB (1 references) target prot opt source destination KUBE-MARK-MASQ all -- 10.244.1.49 0.0.0.0/0 /* default/demoapp:80-80 */ DNAT tcp -- 0.0.0.0/0 0.0.0.0/0 /* default/demoapp:80-80 */ tcp DNAT [unsupported revision]
部署 dashboard 官网: https://kubernetes.io/zh/docs/tasks/access-application-cluster/web-ui-dashboard/ https://github.com/kubernetes/dashboard
1 2 3 4 5 6 7 8 9 10 11 12 13 14 15 16 17 18 19 20 21 22 23 24 25 26 27 28 29 30 31 32 33 34 35 36 37 38 39 40 41 42 43 44 45 46 47 48 kubectl apply -f https://raw.githubusercontent.com/kubernetes/dashboard/v2.2.0/aio/deploy/recommended.yaml namespace/kubernetes-dashboard created serviceaccount/kubernetes-dashboard created service/kubernetes-dashboard created secret/kubernetes-dashboard-certs created secret/kubernetes-dashboard-csrf created secret/kubernetes-dashboard-key-holder created configmap/kubernetes-dashboard-settings created role.rbac.authorization.k8s.io/kubernetes-dashboard created clusterrole.rbac.authorization.k8s.io/kubernetes-dashboard created rolebinding.rbac.authorization.k8s.io/kubernetes-dashboard created clusterrolebinding.rbac.authorization.k8s.io/kubernetes-dashboard created deployment.apps/kubernetes-dashboard created service/dashboard-metrics-scraper created deployment.apps/dashboard-metrics-scraper created cat <<EOF | kubectl apply -f - apiVersion: v1 kind: ServiceAccount metadata: name: admin-user namespace: kubernetes-dashboard EOF cat <<EOF | kubectl apply -f - apiVersion: rbac.authorization.k8s.io/v1 kind: ClusterRoleBinding metadata: name: admin-user roleRef: apiGroup: rbac.authorization.k8s.io kind: ClusterRole name: cluster-admin subjects: - kind: ServiceAccount name: admin-user namespace: kubernetes-dashboard EOF kubectl -n kubernetes-dashboard get secret $(kubectl -n kubernetes-dashboard get sa/admin-user -o jsonpath="{.secrets[0].name}" ) -o go-template="{{.data.token | base64decode}}" xxxxxxxxxxxxxxxxxxxxxxxxxxxxxxx
命令行代理 还得使用代理才能访问到 Dashboard 的服务
1 2 kubectl proxy Starting to serve on 127.0.0.1:8001
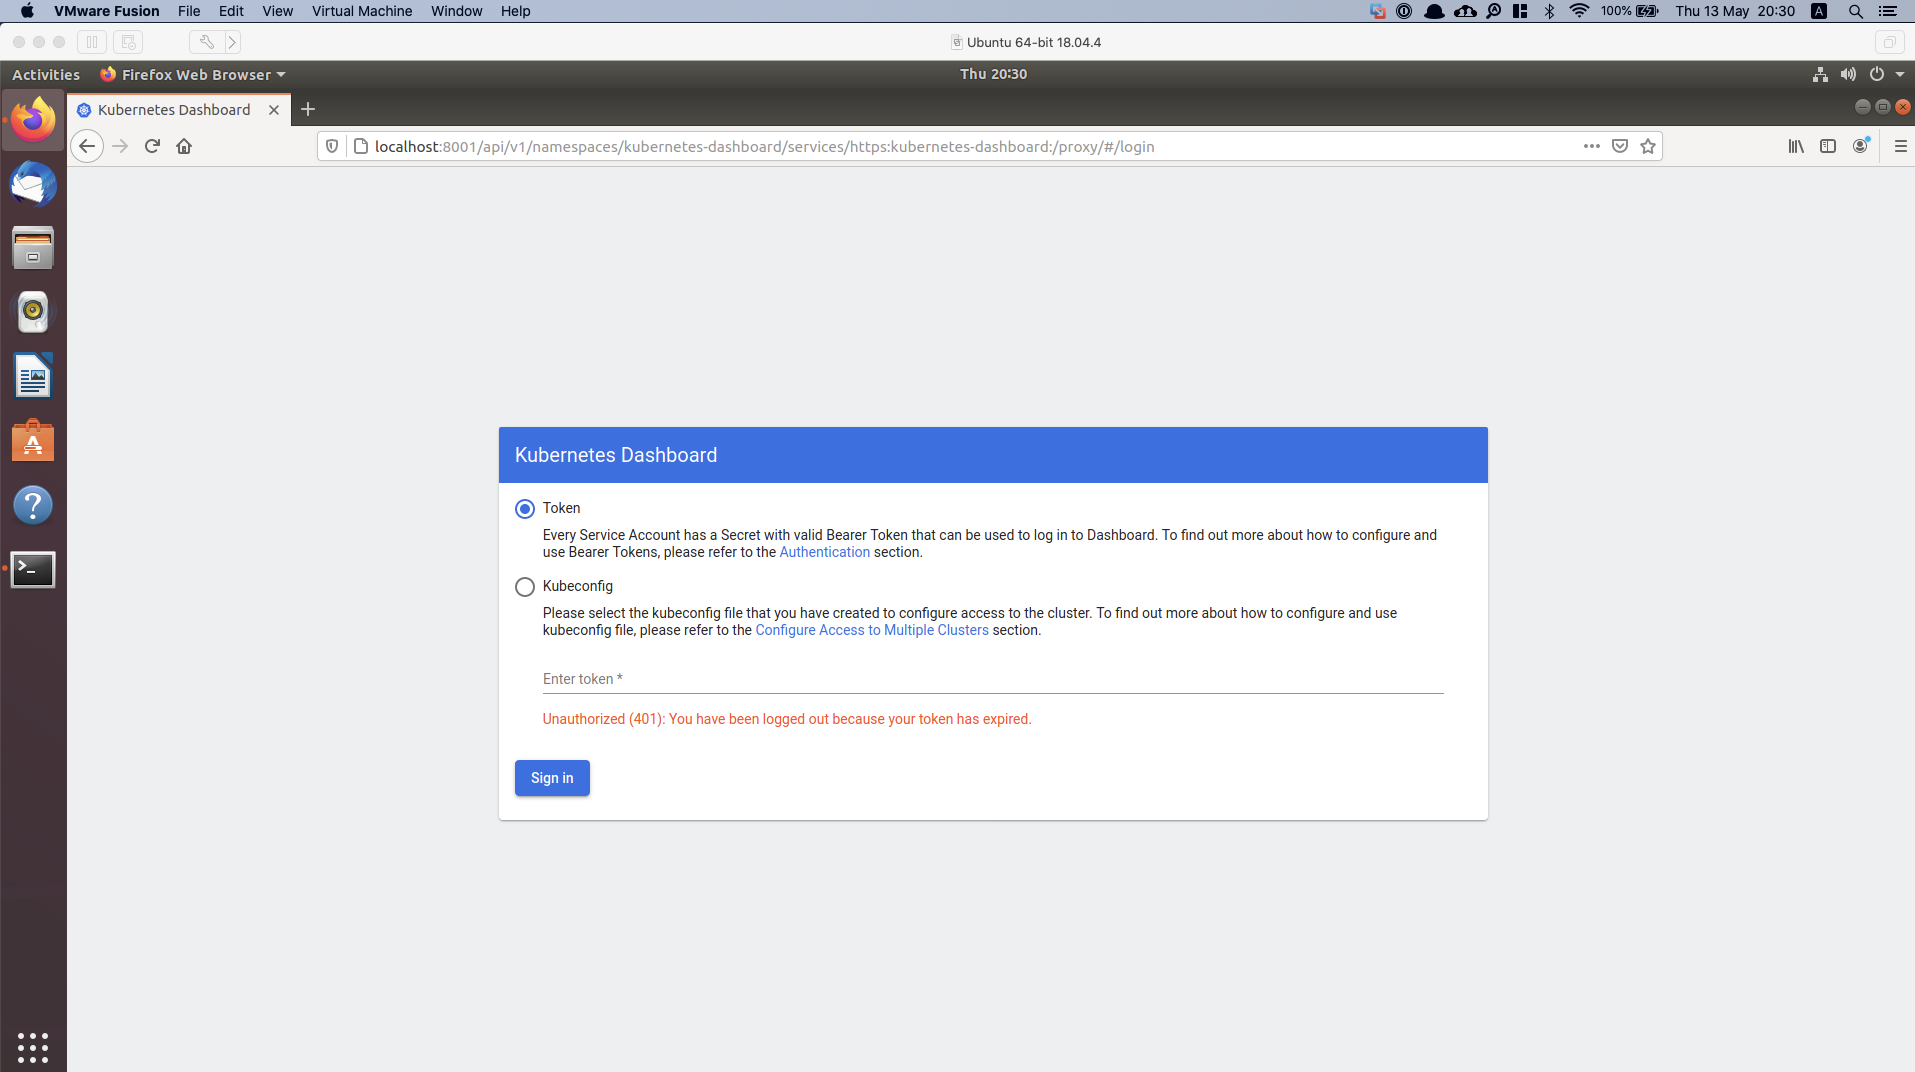
kubectl 会使得 Dashboard 可以通过 http://localhost:8001/api/v1/namespaces/kubernetes-dashboard/services/https:kubernetes-dashboard:/proxy/ 访问
打开 master 虚拟机桌面,用 Firefox 浏览器输入网址 http://localhost:8001/api/v1/namespaces/kubernetes-dashboard/services/https:kubernetes-dashboard:/proxy/ 并输入上面得到的 Bearer Token 登录
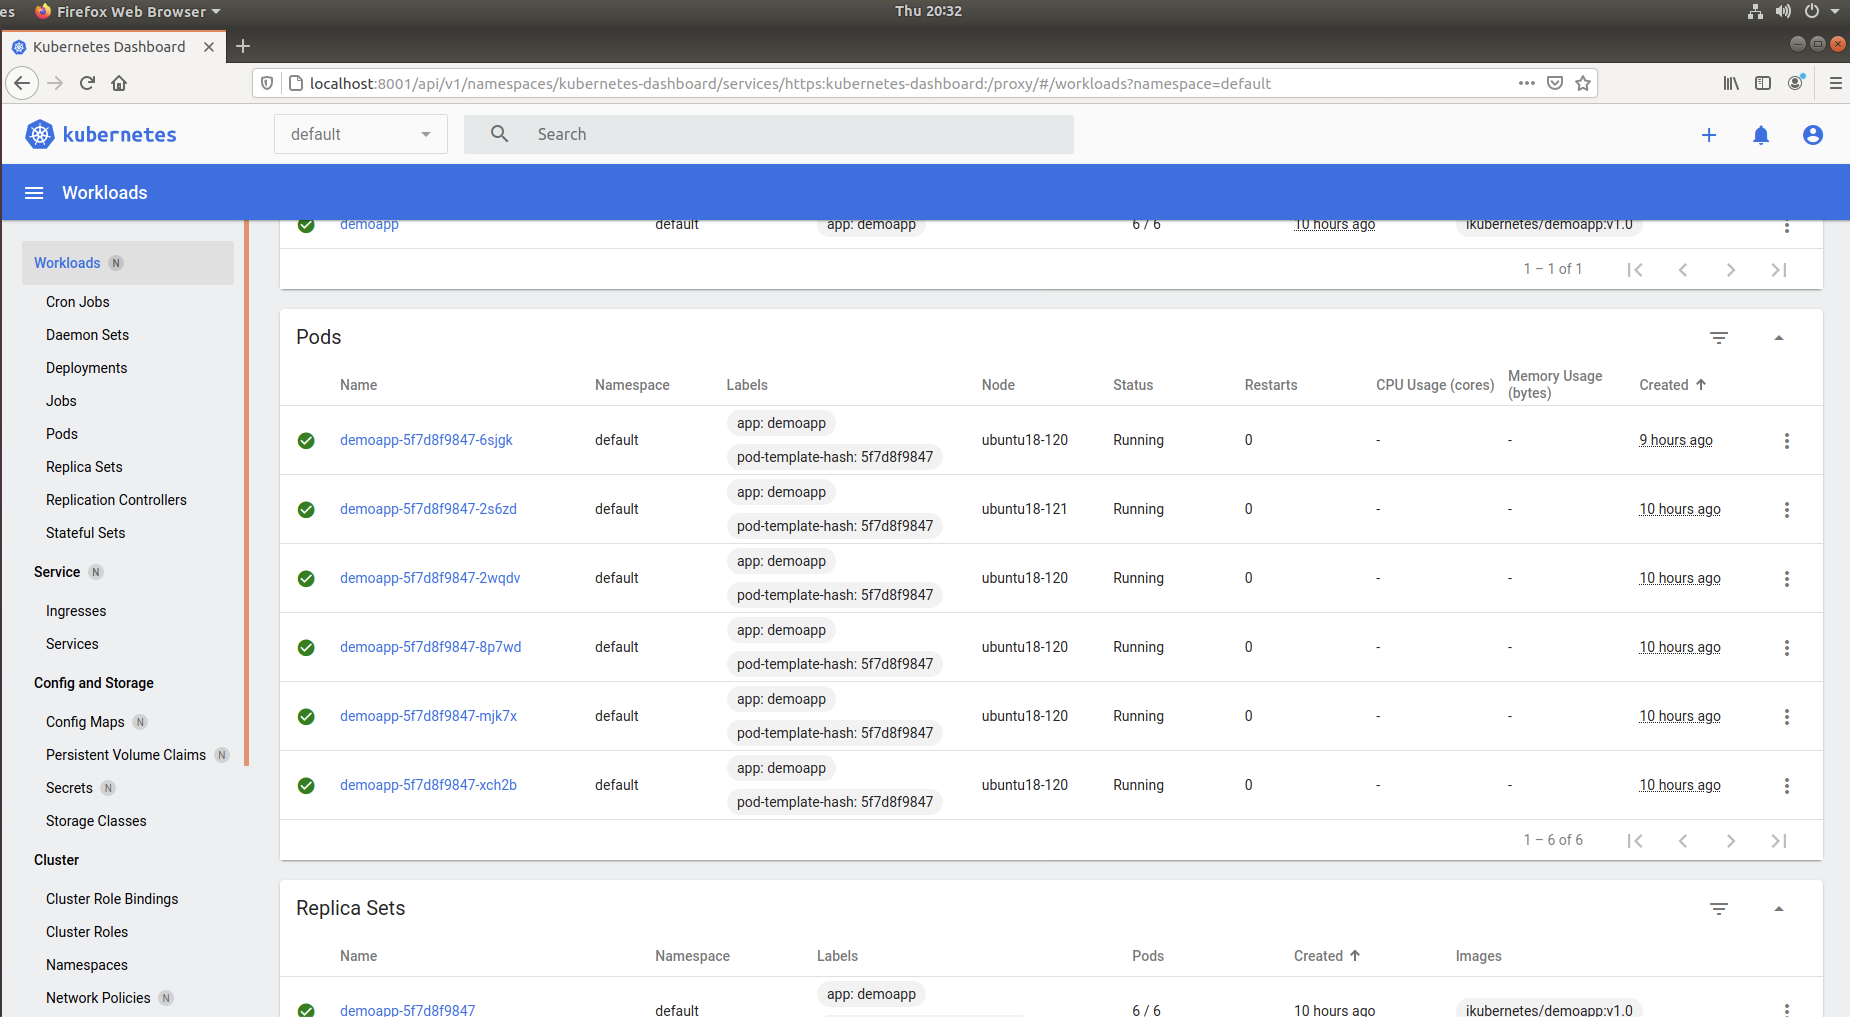
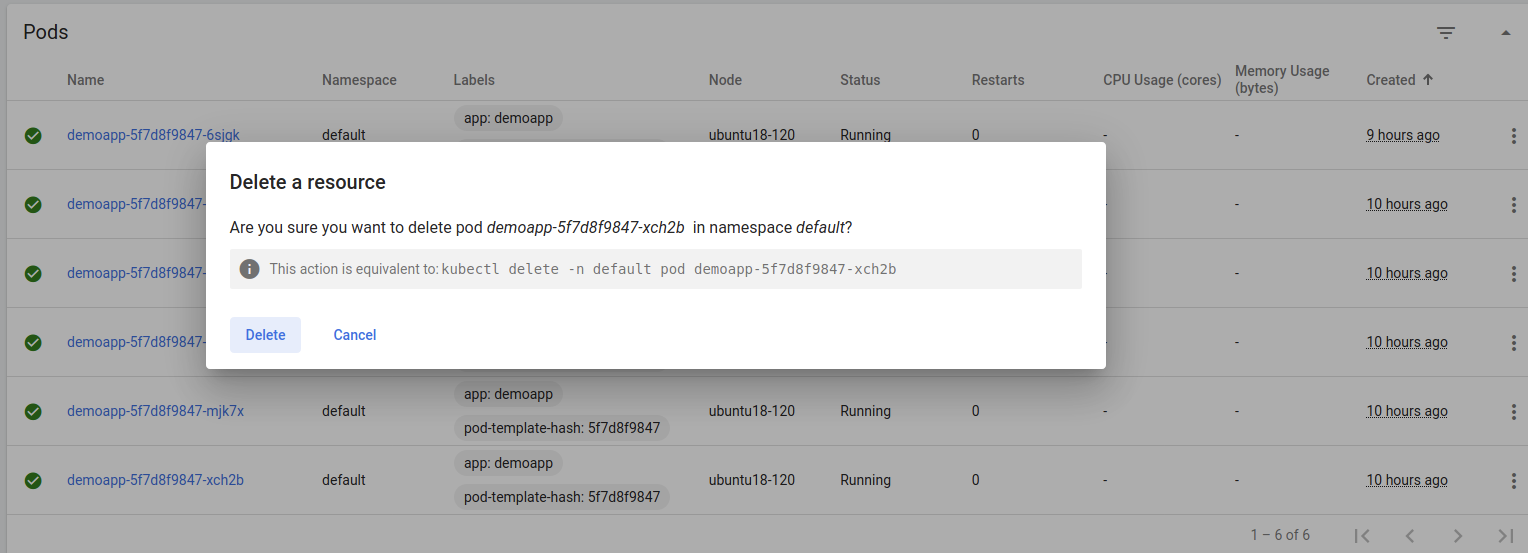
成功登录以后,就可以看到整个集群的情况和做一些相关的操作了
nginx proxy 因为 Dashboard 监听在 127.0.0.1:8001,没有暴露服务给 public,这里我们可以用 Nginx 反向代理师兄
首先安装 Nginx1 2 3 4 sudo apt update sudo apt install nginx
设置代理转发,配置文件如下1 2 3 4 5 6 7 8 9 10 11 12 13 14 15 16 17 18 19 20 21 22 23 24 25 26 27 28 29 30 31 32 33 34 35 36 37 vim /etc/nginx/sites-enabled/k8s-dashboard.conf upstream k8s-dashboard { server 127.0.0.1:8001; keepalive 15; } server { listen 192.168.1.119:8080; server_name 192.168.1.119; access_log /var/log/nginx/k8s-dashboard.access.log; error_log /var/log/nginx/k8s-dashboard.error.log; location / { proxy_http_version 1.1; proxy_buffer_size 64k; proxy_buffers 32 32k; proxy_busy_buffers_size 128k; proxy_set_header Host $host ; proxy_set_header X-Real-IP $remote_addr ; proxy_set_header X-Forwarded-For $proxy_add_x_forwarded_for ; proxy_set_header Connection "Keep-Alive" ; proxy_set_header Proxy-Connection "Keep-Alive" ; proxy_pass http://k8s-dashboard; } } systemctl start nginx systemctl enable nginx rm -f /etc/nginx/sites-enabled/default
踩过的坑 虚拟机双网卡 如果虚拟机是双网卡,一般默认的是 NAT 那一张,桥接的在第二张。在我本次实验中,当安装完 flannel 网络后,却发现有错误。
1 2 3 kubectl logs kube-flannel-ds-6xxs5 --namespace=kube-system kubectl describe pod kube-flannel-ds-6xxs5 --namespace=kube-system
日志的结果显示,用了 NAT 那一张网卡,导致和最开始设置的 apiserver-advertise-address=192.168.1.119 无法连接,启动失败了。
Flannel网络 通常,仅Flannel一类的网络插件需要手动指定该地址
1 --service-cidr=10.245.0.0/16