0%

ELK 日志收集系统快速搭建

ELK 官方文档 是一个分布式、可扩展、实时的搜索与数据分析引擎。目前我在工作中只用来收集 server 的 log, 开发锅锅们 debug 的好助手。

参考文章

  1. 腾讯云Elasticsearch Service 这个腾讯云的专栏非常的不错,请您一定要点开看一眼,总有你想要的。
  2. ELK重难点总结和整体优化配置
  3. 腾讯万亿级 Elasticsearch 技术实战

安装设置单节点 ELK

如果你想快速的搭建单节点 ELK, 那么使用 docker 方式肯定是你的最佳选择。使用三合一的镜像,文档详情
注意:安装完 docker, 记得设置 mmap counts 大小至少 262144
什么是 mmap

1
2
3
4
5
6
7
8
9
10
11
12
13
14
15
16
17
18
19
20
# 设置 mmap 命令 二选一
# 一临时添加法
sysctl -w vm.max_map_count=262144

# 二永久写入文件
vim /etc/sysctl.conf
vm.max_map_count=262144

# 保存好文件执行以下命令查看
sysctl -p

# 安装 docker 基于centos
sudo yum install -y yum-utils device-mapper-persistent-data lvm2

sudo yum-config-manager --add-repo https://download.docker.com/linux/centos/docker-ce.repo

sudo yum install -y docker-ce

sudo systemctl start docker

单节点的机器,不必暴露 9200(Elasticsearch JSON interface) 和 9300(Elasticsearch transport interface) 端口。
如果想在 docker 上暴露端口,用 -p 如果没有填写监听的地址,默认是 0.0.0.0 所有的网卡。建议还是写明确监听的地址,安全性更好。

1
2
-p 监听的IP:宿主机端口:容器内的端口
-p 192.168.10.10:9300:9300

命令行启动一个 ELK

1
2
3
4
5
sudo docker run -p 5601:5601 -p 5044:5044 \
-v /data/elk-data:/var/lib/elasticsearch \
-v /data/elk/logstash:/etc/logstash/conf.d \
-it -e TZ="Asia/Singapore" -e ES_HEAP_SIZE="20g" \
-e LS_HEAP_SIZE="10g" --name elk-ubuntu sebp/elk

将配置和数据挂载出来,即使 docker container 出现了问题。可以立即销毁再重启一个,服务受影响的时间很短。

1
2
3
4
5
6
# 注意挂载出来的文件夹的权限问题
chmod 755 /data/elk-data
chmod 755 /data/elk/logstash
chown -R root:root /data
-v /data/elk-data:/var/lib/elasticsearch # 将 elasticsearch 存储的数据挂载出来,数据持久化。
-v /data/elk/logstash:/etc/logstash/conf.d # 将 logstash 的配置文件挂载出来,方便在宿主机上修改。

elasticsearch 重要的参数调优

  1. ES_HEAP_SIZE Elasticsearch will assign the entire heap specified in jvm.options via the Xms (minimum heap size) and Xmx (maximum heap size) settings. You should set these two settings to be equal to each other. Set Xmx and Xms to no more than 50% of your physical RAM.the exact threshold varies but is near 32 GB. the exact threshold varies but 26 GB is safe on most systems, but can be as large as 30 GB on some systems.
    利弊关系: The more heap available to Elasticsearch, the more memory it can use for its internal caches, but the less memory it leaves available for the operating system to use for the filesystem cache. Also, larger heaps can cause longer garbage collection pauses.
  2. LS_HEAP_SIZE 如果 heap size 过低,会导致 CPU 利用率到达瓶颈,造成 JVM 不断的回收垃圾。 不能设置 heap size 超过物理内存。 至少留 1G 给操作系统和其他的进程。
  3. 若是采用上述这个三合一的 docker 镜像,官方文档, 对于 ELK 的日志,处理的方式为 Note that ELK’s logs are rotated daily and are deleted after a week, using logrotate. You can change this behaviour by overwriting the elasticsearch, logstash and kibana files in /etc/logrotate.d
    1
    2
    # 每天的 6:25 会对日志进行分割压缩处理,此时对机器的 disk 有大量的 IO 工作,会导致 system load 上升。 
    25 6 * * * root test -x /usr/sbin/anacron || ( cd / && run-parts --report /etc/cron.daily )
    这里的解决办法请看下文的自定义部分。
  4. 使用Elasticsearch的REST Client的An HTTP line is larger than 4096 bytes
    {“type”:”too_long_frame_exception”,”reason”:”An HTTP line is larger than 4096 bytes.”},默认情况下ES对请求参数设置为4K,如果遇到请求参数长度限制可以在elasticsearch.yml中修改如下参数: 请参考官方文档
    1
    2
    http.max_initial_line_length: 8k
    http.max_header_size: 16k

elasticsearch 普通方式安装

也是非常的简单,官方文档,或者是民间文档,其实也就是安装一个 JDK, 然后添加一个 repo 仓库。

filebeat 配置

在 client 端,我们需要安装并且配置 filebeat 请参考
Filebeat 模块与配置
配置文件 filebeat.yml

1
2
3
4
5
6
7
8
9
10
11
12
13
14
15
16
17
18
19
20
21
filebeat.inputs:
- type: log
enabled: true
paths: # 需要收集的日志
- /var/log/app/** ## ** need high versiob filebeat can support recursive
exclude_files: ['^/var/log/ocha/no_need_foler/']

fields: #需要添加的字段
host: "{{inventory_hostname}}"
function: "xxx"
multiline: # 多行匹配
match: after
negate: true # pay attention the format
pattern: '^\[[0-9]{4}-[0-9]{2}-[0-9]{2}' #\[
ignore_older: 24h
clean_inactive: 72h

output.logstash:
hosts: ["{{elk_server}}:25044"]
# ssl:
# certificate_authorities: ["/etc/filebeat/logstash.crt"]

批量部署 filebeat.yml 最好使用 ansible

1
2
3
4
5
6
7
8
9
10
11
12
13
14
15
16
17
18
19
20
21
22
23
24
25
26
27
28
29
---
- hosts: all
become: yes
gather_facts: yes
tasks:
- name: stop filebeat
service:
name: filebeat
state: stopped
enabled: yes

- name: upload filebeat.yml
template:
src: filebeat.yml
dest: /etc/filebeat/filebeat.yml
owner: root
group: root
mode: 0644

- name: remove
file: #delete all files in this directory
path: /var/lib/filebeat/registry
state: absent

- name: restart filebeat
service:
name: filebeat
state: restarted
enabled: yes

查看 filebeat output

首先需要修改配置,将 filebeat 输出到本地的文件,输出的格式为 json.

1
2
3
4
5
6
7
8
9
10
11
12
13
14
15
16
17
18
filebeat.inputs:
- type: log
enabled: true
paths:
- /var/log/app/**
fields:
host: "x.x.x.x"
region: "sg"
multiline:
match: after
negate: true
pattern: '^[0-9]{4}-[0-9]{2}-[0-9]{2}'
ignore_older: 24h
clean_inactive: 72h

output.file:
path: "/home/feiyang"
filename: feiyang.json

通过上述的配置,我们就可以在路径 /home/feiyang 下得到输出结果文件 feiyang.json 在这里需要注意的是,不同版本的 filebeat 输出结果的格式会有所不同,这会给 logstash 解析过滤造成一点点困难。下面举例说明 6.x 和 7.x filebeat 输出结果的不同

1
2
3
4
5
6
7
8
9
10
11
12
13
14
15
16
17
18
19
20
21
22
23
24
25
# 这是 6.4.2 的 filebeat

{
"@timestamp": "2019-06-27T15:53:27.682Z",
"@metadata": {
"beat": "filebeat",
"type": "doc",
"version": "6.4.2"
},
"fields": {
"host": "x.x.x.x",
"region": "sg"
},
"host": {
"name": "x.x.x.x"
},
"beat": {
"name": "x.x.x.x",
"hostname": "feiyang-localhost",
"version": "6.4.2"
},
"offset": 1567983499,
"message": "[2019-06-27T22:53:25.756327232][Info][@http.go.177] [48552188]request",
"source": "/var/log/feiyang/scripts/all.log"
}

6.4 与 7.2 还是有很大的差异,在结构上。

1
2
3
4
5
6
7
8
9
10
11
12
13
14
15
16
17
18
19
20
21
22
23
24
25
26
27
28
29
30
31
32
33
34
35
36
37
38
# 这是 7.2.0 的 filebeat


{
"@timestamp": "2019-06-27T15:41:42.991Z",
"@metadata": {
"beat": "filebeat",
"type": "_doc",
"version": "7.2.0"
},
"agent": {
"id": "3a38567b-e6c3-4b5a-a420-f0dee3a3bec8",
"version": "7.2.0",
"type": "filebeat",
"ephemeral_id": "b7e3c0b7-b460-4e43-a9af-6d36c25eece7",
"hostname": "feiyang-localhost"
},
"log": {
"offset": 69132192,
"file": {
"path": "/var/log/app/feiyang/scripts/info.log"
}
},
"message": "2019-06-27 22:41:25.312|WARNING|14186|Option|data|unrecognized|fields=set([u'id'])",
"input": {
"type": "log"
},
"fields": {
"region": "sg",
"host": "x.x.x.x"
},
"ecs": {
"version": "1.0.0"
},
"host": {
"name": "feiyang-localhost"
}
}

只需要配置logstash

接下来,我们再来看一看 logstash.conf 记得看注释
参考链接:

  1. SSL详情可参考
  2. grok 正则捕获
  3. grok插件语法介绍
  4. logstash 配置语法
  5. grok 内置 pattern
  6. Logstash详细记录
1
2
3
4
5
6
7
8
9
10
11
12
13
14
15
16
17
18
19
20
21
22
23
24
25
26
27
28
29
30
31
32
33
34
35
36
37
38
39
40
41
42
43
44
45
46
47
48
49
50
51
52
53
54
55
56
57
58
59
60
61
62
63
64
65
66
67
68
69
70
71
72
73
74
75
76
77
78
79
80
81
82
input {
beats {
port => 5044
#host => "192.168.1.1" 监听内网
#ssl => true
#ssl_certificate => "/etc/logstash/logstash.crt"
#ssl_key => "/etc/logstash/logstash.key"
# 1. SSL详情可参考
}
}
# filter 模块主要是数据预处理,提取一些信息,方便 elasticsearch 好归类存储。
# 2. grok 正则捕获
# 3. grok插件语法介绍
# 4. logstash 配置语法
# 5. grok 内置 pattern
filter {
grok {
match => {"message" => "%{EXIM_DATE:timestamp}\|%{LOGLEVEL:log_level}\|%{INT:pid}\|%{GREEDYDATA}"}
# message 字段是 log 的内容,例如 2018-12-11 23:46:47.051|DEBUG|3491|helper.py:85|helper._save_to_cache|shop_session
# 在这里我们提取出了 timestamp log_level pid,grok 有内置定义好的patterns: EXIM_DATE, EXIM_DATE, INT
# GREEDYDATA 贪婪数据,代表任意字符都可以匹配
}
# 我们在 filebeat 里面添加了这个字段[fields][function]的话,那就会执行对应的 match 规则去匹配 path
# source 字段就是 log 的来源路径,例如 /var/log/nginx/feiyang233.club.access.log
# match 后我们就可以得到 path=feiyang233.club.access
if [fields][function]=="nginx" {
grok {
match => {"source" => "/var/log/nginx/%{GREEDYDATA:path}.log%{GREEDYDATA}"}
}
}
# 例如 ims 日志来源是 /var/log/ims_logic/debug.log
# match 后我们就可以得到 path=ims_logic
else if [fields][function]=="ims" {
grok {
match => {"source" => "/var/log/%{GREEDYDATA:path}/%{GREEDYDATA}"}
}
}

else {
grok {
match => {"source" => "/var/log/app/%{GREEDYDATA:path}/%{GREEDYDATA}"}
}
}
# filebeat 有定义 [fields][function] 时,我们就添加上这个字段,例如 QA
if [fields][function] {
mutate {
add_field => {
"function" => "%{[fields][function]}"
}
}
}
# 因为线上的机器更多,线上的我默认不在 filebeat 添加 function,所以 else 我就添加上 live
else {
mutate {
add_field => {
"function" => "live"
}
}
}
# 在之前 filter message 时,我们得到了 timestamp,这里我们修改一下格式,添加上时区。
date {
match => ["timestamp" , "yyyy-MM-dd HH:mm:ss Z"]
target => "@timestamp"
timezone => "Asia/Singapore"
}
# 将之前获得的 path 替换其中的 / 替换为 - , 因为 elasticsearch index name 有要求
# 例如 feiyang/test feiyang_test
mutate {
gsub => ["path","/","-"]
add_field => {"host_ip" => "%{[fields][host]}"}
remove_field => ["tags","@version","offset","beat","fields","exim_year","exim_month","exim_day","exim_time","timestamp"]
}
# remove_field 去掉一些多余的字段
}
# 单节点 output 就在本机,也不需要 SSL, 但 index 的命名规则还是需要非常的注意
output {
elasticsearch {
hosts => ["localhost:9200"]
index => "sg-%{function}-%{path}-%{+xxxx.ww}"
# sg-nginx-feiyang233.club.access-2019.13 ww代表周数
}
}

最终的流程图如下所示
log
index 的规则 参考链接

  • Lowercase only
  • Cannot include , /, *, ?, “, <, >, |, ` ` (space character), ,, #
  • Indices prior to 7.0 could contain a colon (:), but that’s been deprecated and won’t be supported in 7.0+
  • Cannot start with -, _, +
  • Cannot be . or ..
  • Cannot be longer than 255 bytes (note it is bytes, so multi-byte characters will count towards the 255 limit faster)

Kibana 简单的使用

在搭建 ELK 时,暴露出来的 5601 端口就是 Kibana 的服务。
访问 http://your_elk_ip:5601
kibana

安装设置集群 ELK 版本 6.7

ELK 安装文档集群主要是高可用,多节点的 Elasticsearch 还可以扩容。本文中用的官方镜像 The base image is centos:7

Elasticsearch 多节点搭建

官方安装文档 Elasticsearch

1
2
3
4
5
6
7
# 挂载出来的文件夹权限非常的重要
mkdir -p /data/elk-data && chmod 755 /data/elk-data
chown -R root:root /data
docker run -p WAN_IP:9200:9200 -p 10.66.236.116:9300:9300 \
-v /data/elk-data:/usr/share/elasticsearch/data \
--name feiy_elk \
docker.elastic.co/elasticsearch/elasticsearch:6.7.0

接下来是修改配置文件 elasticsearch.yml

1
2
3
4
5
6
7
8
9
10
11
12
13
14
# Master 节点 node-1
# 进入容器 docker exec -it [container_id] bash
# docker exec -it 70ada825aae1 bash
# vi /usr/share/elasticsearch/config/elasticsearch.yml
cluster.name: "feiy_elk"
network.host: 0.0.0.0
node.master: true
node.data: true
node.name: node-1
network.publish_host: 10.66.236.116
discovery.zen.ping.unicast.hosts: ["10.66.236.116:9300","10.66.236.118:9300","10.66.236.115:9300"]

# exit
# docker restart 70ada825aae1
1
2
3
4
5
6
7
8
9
10
11
12
# slave 节点 node-2
# 进入容器 docker exec -it [container_id] bash
# vi /usr/share/elasticsearch/config/elasticsearch.yml
cluster.name: "feiy_elk"
network.host: "0.0.0.0"
node.name: node-2
node.data: true
network.publish_host: 10.66.236.118
discovery.zen.ping.unicast.hosts: ["10.66.236.116:9300","10.66.236.118:9300","10.66.236.115:9300"]

# exit
# docker restart 70ada825aae1
1
2
3
4
5
6
7
8
9
10
11
12
# slave 节点 node-3
# 进入容器 docker exec -it [container_id] bash
# vi /usr/share/elasticsearch/config/elasticsearch.yml
cluster.name: "feiy_elk"
network.host: "0.0.0.0"
node.name: node-3
node.data: true
network.publish_host: 10.66.236.115
discovery.zen.ping.unicast.hosts: ["10.66.236.116:9300","10.66.236.118:9300","10.66.236.115:9300"]

# exit
# docker restart 70ada825aae1

检查集群节点个数,状态等 Cluster get settings API

1
2
3
4
5
6
7
8
9
10
11
12
13
14
15
16
17
18
19
20
21
22
23
24
25

curl http://127.0.0.1:9200/_cluster/health?pretty
# curl http://wan_ip:9200/_cluster/health?pretty
{
"cluster_name" : "feiy_elk",
"status" : "green",
"timed_out" : false,
"number_of_nodes" : 3,
"number_of_data_nodes" : 3,
"active_primary_shards" : 9,
"active_shards" : 18,
"relocating_shards" : 0,
"initializing_shards" : 0,
"unassigned_shards" : 0,
"delayed_unassigned_shards" : 0,
"number_of_pending_tasks" : 0,
"number_of_in_flight_fetch" : 0,
"task_max_waiting_in_queue_millis" : 0,
"active_shards_percent_as_number" : 100.0
}

curl -X GET "localhost:9200/_cluster/health?wait_for_status=yellow&timeout=50s&pretty"

# in console
GET /_cluster/health?wait_for_status=yellow&timeout=50s

最终结果图在 kibana 上可以看到集群状态
elk

Kibana 搭建

官方安装文档 Kibana

1
2
3
4
5
6
# docker run --link YOUR_ELASTICSEARCH_CONTAINER_NAME_OR_ID:elasticsearch -p 5601:5601 {docker-repo}:{version}
docker run -p 外网IP:5601:5601 --link elasticsearch容器的ID:elasticsearch docker.elastic.co/kibana/kibana:6.7.0

# 注意的是 --link 官方其实并不推荐的,推荐的是 use user-defined networks https://docs.docker.com/network/links/
# 测试不用 --link 也可以通。直接用容器的 IP
docker run -p 外网IP:5601:5601 docker.elastic.co/kibana/kibana:6.7.0

we recommend that you use user-defined networks to facilitate communication between two containers instead of using –link

1
2
3
4
5
6
7
8
9
10
11
12
13
14
15
16
# vi /usr/share/kibana/config/kibana.yml
# 需要把 hosts IP 改为 elasticsearch 容器的 IP
# 我这里 elasticsearch 容器的 IP 是 172.17.0.2
# 如何查看 docker inspect elasticsearch_ID
server.name: kibana
server.host: "0.0.0.0"
elasticsearch.hosts: [ "http://172.17.0.2:9200" ]
xpack.monitoring.ui.container.elasticsearch.enabled: true

# 退出容器并重启
docker restart [container_ID]


# 非容器安装
xpack.monitoring.enabled: enable
xpack.monitoring.elasticsearch: ["http://127.0.0.1:9200"]

Logstash 搭建

官方安装文档 Logstash

1
2
3
4
# docker -d 以后台的方式启动容器  --name 参数显式地为容器命名
docker run -p 5044:5044 -d --name test_logstash docker.elastic.co/logstash/logstash:6.7.0
# 也可以指定网卡,监听在内网或者外网 监听在内网 192.168.1.2
docker run -p 192.168.1.2:5044:5044 -d --name test_logstash docker.elastic.co/logstash/logstash:6.7.0
1
2
3
4
# vi /usr/share/logstash/pipeline/logstash.conf
# 配置详情请参考下面的链接,记得 output hosts IP 指向 Elasticsearch 的 IP
# Elasticsearch 的默认端口是9200,在下面的配置中可以省略。
hosts => ["IP Address 1:port1", "IP Address 2:port2", "IP Address 3"]

logstash 过滤规则 见上文的配置和 grok 语法规则

1
2
3
4
5
6
7
8
9
10
11
12
13
# vi /usr/share/logstash/config/logstash.yml
# 需要把 url 改为 elasticsearch master 节点的 IP
http.host: "0.0.0.0"
xpack.monitoring.elasticsearch.url: http://elasticsearch_master_IP:9200
node.name: "feiy"
pipeline.workers: 24 # same with cores


# 非容器安装
xpack.monitoring.enabled: true
xpack.monitoring.elasticsearch.hosts: ["http://127.0.0.1:9200"]
xpack.monitoring.collection.pipeline.details.enabled: true

改完配置 exit 从容器里退出到宿主机,然后重启这个容器。更多配置详情,参见官方文档

1
2
3
4
# 如何查看 container_ID
docker ps -a

docker restart [container_ID]

容灾测试

我们把当前的 master 节点 node-1 关机,通过 kibana 看看集群的状态是怎样变化的。
elk1
当前集群的状态变成了黄色,因为还有 3 个 Unassigned Shards。颜色含义请参考官方文档,再过一会发现集群状态变成了绿色。
elk2

kibana 控制台 Console

Quick intro to the UI
The Console UI is split into two panes: an editor pane (left) and a response pane (right). Use the editor to type requests and submit them to Elasticsearch. The results will be displayed in the response pane on the right side.

Console understands requests in a compact format, similar to cURL:

1
2
3
4
5
6
7
8
# index a doc
PUT index/type/1
{
"body": "here"
}

# and get it ...
GET index/type/1

While typing a request, Console will make suggestions which you can then accept by hitting Enter/Tab. These suggestions are made based on the request structure as well as your indices and types.

A few quick tips, while I have your attention

  • Submit requests to ES using the green triangle button.
  • Use the wrench menu for other useful things.
  • You can paste requests in cURL format and they will be translated to the Console syntax.
  • You can resize the editor and output panes by dragging the separator between them.
  • Study the keyboard shortcuts under the Help button. Good stuff in there!

Console 常用的命令

Kibana 控制台
ELK技术栈中的那些查询语法

1
2
3
4
5
6
7
8
9
10
11
12
13
14
15
16
17
18
19
20
21
22
23
24
25
26
27
28
29
30
31
32
33
34
35
36
37
38
39
40
41
42
43
44
45
46
curl -X GET "https://user:passwd@IP:9200/_cat/indices?v"

GET _search
{
"query": {
"match_all": {}
}
}

GET /_cat/health?v

GET /_cat/nodes?v

GET /_cluster/allocation/explain

GET /_cluster/state

GET /_cat/thread_pool?v

GET /_cat/indices?health=red&v

GET /_cat/indices?v

#将当前所有的 index 的 replicas 设置为 0

PUT /*/_settings
{
"index" : {
"number_of_replicas" : 0,
"refresh_interval": "30s"
}
}

GET /_template


# 在单节点的时候,不需要备份,所以将 replicas 设置为 0
PUT _template/app-logstash
{
"index_patterns": ["app-*"],
"settings": {
"number_of_shards": 3,
"number_of_replicas": 0,
"refresh_interval": "30s"
}
}
1
2
3
4
5
6
7
8
9
10
11
12
# Delete all indices in your Elastic Search cluster
for i in `curl 'localhost:9200/_cat/indices?v' | tail -n +2 | awk '{print $3}'`; do curl -XDELETE "http://127.0.0.1:9200/$i"; done


# vim delete_elk.sh

#!/bin/bash
for i in `curl 'localhost:9200/_cat/indices?v' | tail -n +2 | awk '{print $3}'`; do
curl -XDELETE "http://127.0.0.1:9200/$i";
done
sleep 5s
systemctl restart elasticsearch

Elasticsearch 数据迁移

Elasticsearch 数据迁移官方文档感觉不是很详细。容器化的数据迁移,我太菜用 reindex 失败了,snapshot 也凉凉。
最后是用一个开源工具 An Elasticsearch Migration Tool 进行数据迁移的。

1
2
3
4
wget https://github.com/medcl/esm-abandoned/releases/download/v0.4.2/linux64.tar.gz
tar -xzvf linux64.tar.gz
./esm -s http://127.0.0.1:9200 -d http://192.168.21.55:9200 -x index_name -w=5 -b=10 -c 10000 --copy_settings --copy_mappings --force --refresh

移除一个数据节点

如何安全的移除一个 data node, 虽然 es 有自我恢复机制,但最佳的方式还是先移除 data node 上的数据: 重新 allocation

在 kibana 的 console 里面允许如下命令,移除 IP 为 10.0.0.1 的 data node

1
2
3
4
5
6
PUT _cluster/settings
{
"transient" : {
"cluster.routing.allocation.exclude._ip" : "10.0.0.1"
}
}

Nginx 代理转发

因为有时候 docker 重启,iptables restart 也会刷新,所以导致了我们的限制规则会被更改,出现安全问题。这是由于 docker 的网络隔离基于 iptable 实现造成的问题。为了避免这个安全问题,我们可以在启动 docker 时,就只监听在内网,或者本地 127.0.0.1 然后通过 nginx 转发。

1
2
3
4
5
6
7
8
9
10
11
12
13
14
15
16
17
18
19
20
21
22
23
24
25
26
27
28
29
30
31
32
# cat kibana.conf
upstream kibana {
server 127.0.0.1:5601;
keepalive 15;
}

server {

listen 25601;
server_name x.x.x.x;
access_log /var/log/nginx/kibana.access.log;
error_log /var/log/nginx/kibana.error.log;

location / {
allow x.x.x.x;
allow x.x.x.x;
deny all;

proxy_http_version 1.1;
proxy_buffer_size 64k;
proxy_buffers 32 32k;
proxy_busy_buffers_size 128k;
proxy_set_header Host $host;
proxy_set_header X-Real-IP $remote_addr;
proxy_set_header X-Forwarded-For $proxy_add_x_forwarded_for;
proxy_set_header Connection "Keep-Alive";
proxy_set_header Proxy-Connection "Keep-Alive";

proxy_pass http://kibana;

}
}

! 这里需要注意的是, iptable filter 表 INPUT 链 有没有阻挡 172.17.0.0/16 docker 默认的网段。是否阻挡了 25601 这个端口。

踩过的坑

iptables 防不住

需要看上一篇博客里的 iptable 问题。或者监听在内网,用 Nginx 代理转发。

elk 网络问题

elk node

单节点

discovery.type=single-node
在测试单点时可用,搭建集群时不能设置这个环境变量,详情见官方文档

ELK的一次吞吐量优化

filebeat 版本

版本过低导致 recursive glob patterns ** 不可用
用 ansible 升级 filebeat

1
2
3
4
5
6
7
8
9
10
11
12
13
14
15
16
17
18
19
20
21
22
23
24
25
26
27
28
29
30
31
32
33
34
35
36
37
38
39
40
41
42
43
---
- hosts: all
become: yes
gather_facts: yes
tasks:
- name: upload filebeat.repo
copy:
src: elasticsearch.repo
dest: /etc/yum.repos.d/elasticsearch.repo
owner: root
group: root
mode: 0644

- name: install the latest version of filebeat
yum:
name: filebeat
state: latest #6.x.1-1 7.x.1-1

- name: restart filebeat
service:
name: filebeat
state: restarted
enabled: yes

# vim /etc/yum.repos.d/elasticsearch.repo
[elasticsearch-6.x]
name=Elasticsearch repository for 6.x packages
baseurl=https://artifacts.elastic.co/packages/6.x/yum
gpgcheck=1
gpgkey=https://artifacts.elastic.co/GPG-KEY-elasticsearch
enabled=1
autorefresh=1
type=rpm-md

[elasticsearch-7.x]
name=Elasticsearch repository for 7.x packages
baseurl=https://artifacts.elastic.co/packages/7.x/yum
gpgcheck=1
gpgkey=https://artifacts.elastic.co/GPG-KEY-elasticsearch
enabled=1
autorefresh=1
type=rpm-md

filebeat 兼容性

7.x 与 6.x 不兼容问题. 关键字变化很大, 比如说 “sorce” 变为了 [log][file][path]

kibana报错

“message”:”Alias [.kibana] has more than one indices associated with it [[.kibana_1, .kibana_2]] 这是因为 kibana 连接了一台机器,如果我们把这台 host 和 kibana 删除,但 kibana 的数据还会在另外两台 host上。当重新创建 host 加入时,会自动同步 .kibana,kibana 就会报错

7.4版本日志位置

没有写在 /var/log/ 对应的文件夹,而是 sttout , 在 /var/log/messages 下。 或者可以用命令 journalctl -fu logstash 查看最新的日志。

logstash-7.4 启动错误

CentOS 添加好 repo 后, 用 yum install logstash 安装好了以后。正在启动,但没有看到有进程监听 5044 端口, journalctl -fu logstash 查看日志发现报错如下

1
2
3
4
5
6
7
8
9
10
11
12
13
[2019-11-21T19:18:21,800][FATAL][logstash.runner] An unexpected error occurred! 
{:error=><ArgumentError: Path "/var/lib/logstash/dead_letter_queue"
must be a writable directory. It is not writable.

#然后我们修改权限
chmod 777 /var/lib/logstash/dead_letter_queue

# 新的报错为 Access Denied

{:error=>java.nio.file.AccessDeniedException: /var/lib/logstash/.lock

#再次修改权限,终于成功了
chmod 777 /var/lib/logstash/.lock

disk full

once disk usage more than 95%, elasticseach will stop store new data to index, and will add lock for these index. Even you release the disk, the lock is still enable. elk cannot store new data to read-only index. you will see the error log in logstash

1
2
[logstash.outputs.elasticsearch] retrying failed action with response code: 403 
({"type"=>ggq"cluster_block_exception", "reason"=>"blocked by: [FORBIDDEN/12/index read-only / allow delete (api)];"})

The solution is resetting the read-only index

1
2
3
4
5
6
7
8
9
10
11
12
# In consloe 
PUT /index_name/_settings
{
"index.blocks.read_only_allow_delete": null
}

# URL
curl -X PUT "localhost:9200/index_name/_settings?pretty" -H 'Content-Type: application/json' -d'
{
"index.blocks.read_only_allow_delete": null
}
'

kibana cannot create index

In elasticsearch log, about Fielddata

The index option controls whether field values are indexed. It accepts true or false and defaults to true. Fields that are not indexed are not queryable.

1
2
3
4
5
6
7
8
9
10
11
12
13
14
15
16
17
18
19
20
21
22
23
24
25
26
27
28
29
30
31
32
33
34
35
36
37
38
39
40
41
42
43
44
45
[2020-02-03T00:00:12,211][DEBUG][o.e.a.s.TransportSearchAction] [localhost.localdomain] All shards failed for phase: [query]
org.elasticsearch.ElasticsearchException$1: Fielddata is disabled on text fields by default. Set fielddata=true on [type] in order to load fielddata in memory by uninverting the inverted index. Note that this can however use significant memory. Alternatively use a keyword field instead.
at org.elasticsearch.ElasticsearchException.guessRootCauses(ElasticsearchException.java:639) ~[elasticsearch-7.4.2.jar:7.4.2]
at org.elasticsearch.action.search.AbstractSearchAsyncAction.executeNextPhase(AbstractSearchAsyncAction.java:137) [elasticsearch-7.4.2.jar:7.4.2]
at org.elasticsearch.action.search.AbstractSearchAsyncAction.onPhaseDone(AbstractSearchAsyncAction.java:273) [elasticsearch-7.4.2.jar:7.4.2]
at org.elasticsearch.action.search.InitialSearchPhase.onShardFailure(InitialSearchPhase.java:105) [elasticsearch-7.4.2.jar:7.4.2]
at org.elasticsearch.action.search.InitialSearchPhase.access$200(InitialSearchPhase.java:50) [elasticsearch-7.4.2.jar:7.4.2]
at org.elasticsearch.action.search.InitialSearchPhase$2.onFailure(InitialSearchPhase.java:273) [elasticsearch-7.4.2.jar:7.4.2]
at org.elasticsearch.action.search.SearchExecutionStatsCollector.onFailure(SearchExecutionStatsCollector.java:73) [elasticsearch-7.4.2.jar:7.4.2]
at org.elasticsearch.action.ActionListenerResponseHandler.handleException(ActionListenerResponseHandler.java:59) [elasticsearch-7.4.2.jar:7.4.2]
at org.elasticsearch.action.search.SearchTransportService$ConnectionCountingHandler.handleException(SearchTransportService.java:424) [elasticsearch-7.4.2.jar:7.4.2]
at org.elasticsearch.transport.TransportService$ContextRestoreResponseHandler.handleException(TransportService.java:1120) [elasticsearch-7.4.2.jar:7.4.2]
at org.elasticsearch.transport.TransportService$DirectResponseChannel.processException(TransportService.java:1229) [elasticsearch-7.4.2.jar:7.4.2]
at org.elasticsearch.transport.TransportService$DirectResponseChannel.sendResponse(TransportService.java:1203) [elasticsearch-7.4.2.jar:7.4.2]
at org.elasticsearch.transport.TaskTransportChannel.sendResponse(TaskTransportChannel.java:60) [elasticsearch-7.4.2.jar:7.4.2]
at org.elasticsearch.action.support.ChannelActionListener.onFailure(ChannelActionListener.java:56) [elasticsearch-7.4.2.jar:7.4.2]
at org.elasticsearch.action.ActionListener$1.onFailure(ActionListener.java:70) [elasticsearch-7.4.2.jar:7.4.2]
at org.elasticsearch.action.ActionListener$1.onResponse(ActionListener.java:64) [elasticsearch-7.4.2.jar:7.4.2]
at org.elasticsearch.search.SearchService.lambda$rewriteShardRequest$7(SearchService.java:1043) [elasticsearch-7.4.2.jar:7.4.2]
at org.elasticsearch.action.ActionRunnable$1.doRun(ActionRunnable.java:45) [elasticsearch-7.4.2.jar:7.4.2]
at org.elasticsearch.common.util.concurrent.AbstractRunnable.run(AbstractRunnable.java:37) [elasticsearch-7.4.2.jar:7.4.2]
at org.elasticsearch.common.util.concurrent.TimedRunnable.doRun(TimedRunnable.java:44) [elasticsearch-7.4.2.jar:7.4.2]
at org.elasticsearch.common.util.concurrent.ThreadContext$ContextPreservingAbstractRunnable.doRun(ThreadContext.java:773) [elasticsearch-7.4.2.jar:7.4.2]
at org.elasticsearch.common.util.concurrent.AbstractRunnable.run(AbstractRunnable.java:37) [elasticsearch-7.4.2.jar:7.4.2]
at java.util.concurrent.ThreadPoolExecutor.runWorker(ThreadPoolExecutor.java:1128) [?:?]
at java.util.concurrent.ThreadPoolExecutor$Worker.run(ThreadPoolExecutor.java:628) [?:?]
at java.lang.Thread.run(Thread.java:830) [?:?]
Caused by: java.lang.IllegalArgumentException: Fielddata is disabled on text fields by default. Set fielddata=true on [type] in order to load fielddata in memory by uninverting the inverted index. Note that this can however use significant memory. Alternatively use a keyword field instead.
at org.elasticsearch.index.mapper.TextFieldMapper$TextFieldType.fielddataBuilder(TextFieldMapper.java:759) ~[elasticsearch-7.4.2.jar:7.4.2]
at org.elasticsearch.index.fielddata.IndexFieldDataService.getForField(IndexFieldDataService.java:116) ~[elasticsearch-7.4.2.jar:7.4.2]
at org.elasticsearch.index.query.QueryShardContext.getForField(QueryShardContext.java:191) ~[elasticsearch-7.4.2.jar:7.4.2]
at org.elasticsearch.search.aggregations.support.ValuesSourceConfig.resolve(ValuesSourceConfig.java:112) ~[elasticsearch-7.4.2.jar:7.4.2]
at org.elasticsearch.search.aggregations.support.ValuesSourceAggregationBuilder.resolveConfig(ValuesSourceAggregationBuilder.java:350) ~[elasticsearch-7.4.2.jar:7.4.2]
at org.elasticsearch.search.aggregations.support.ValuesSourceAggregationBuilder.doBuild(ValuesSourceAggregationBuilder.java:322) ~[elasticsearch-7.4.2.jar:7.4.2]
at org.elasticsearch.search.aggregations.support.ValuesSourceAggregationBuilder.doBuild(ValuesSourceAggregationBuilder.java:39) ~[elasticsearch-7.4.2.jar:7.4.2]
at org.elasticsearch.search.aggregations.AbstractAggregationBuilder.build(AbstractAggregationBuilder.java:139) ~[elasticsearch-7.4.2.jar:7.4.2]
at org.elasticsearch.search.aggregations.AggregatorFactories$Builder.build(AggregatorFactories.java:332) ~[elasticsearch-7.4.2.jar:7.4.2]
at org.elasticsearch.search.SearchService.parseSource(SearchService.java:784) ~[elasticsearch-7.4.2.jar:7.4.2]
at org.elasticsearch.search.SearchService.createContext(SearchService.java:586) ~[elasticsearch-7.4.2.jar:7.4.2]
at org.elasticsearch.search.SearchService.createAndPutContext(SearchService.java:545) ~[elasticsearch-7.4.2.jar:7.4.2]
at org.elasticsearch.search.SearchService.executeQueryPhase(SearchService.java:348) ~[elasticsearch-7.4.2.jar:7.4.2]
at org.elasticsearch.search.SearchService.lambda$executeQueryPhase$1(SearchService.java:340) ~[elasticsearch-7.4.2.jar:7.4.2]
at org.elasticsearch.action.ActionListener.lambda$map$2(ActionListener.java:145) ~[elasticsearch-7.4.2.jar:7.4.2]
at org.elasticsearch.action.ActionListener$1.onResponse(ActionListener.java:62) ~[elasticsearch-7.4.2.jar:7.4.2]
... 9 more
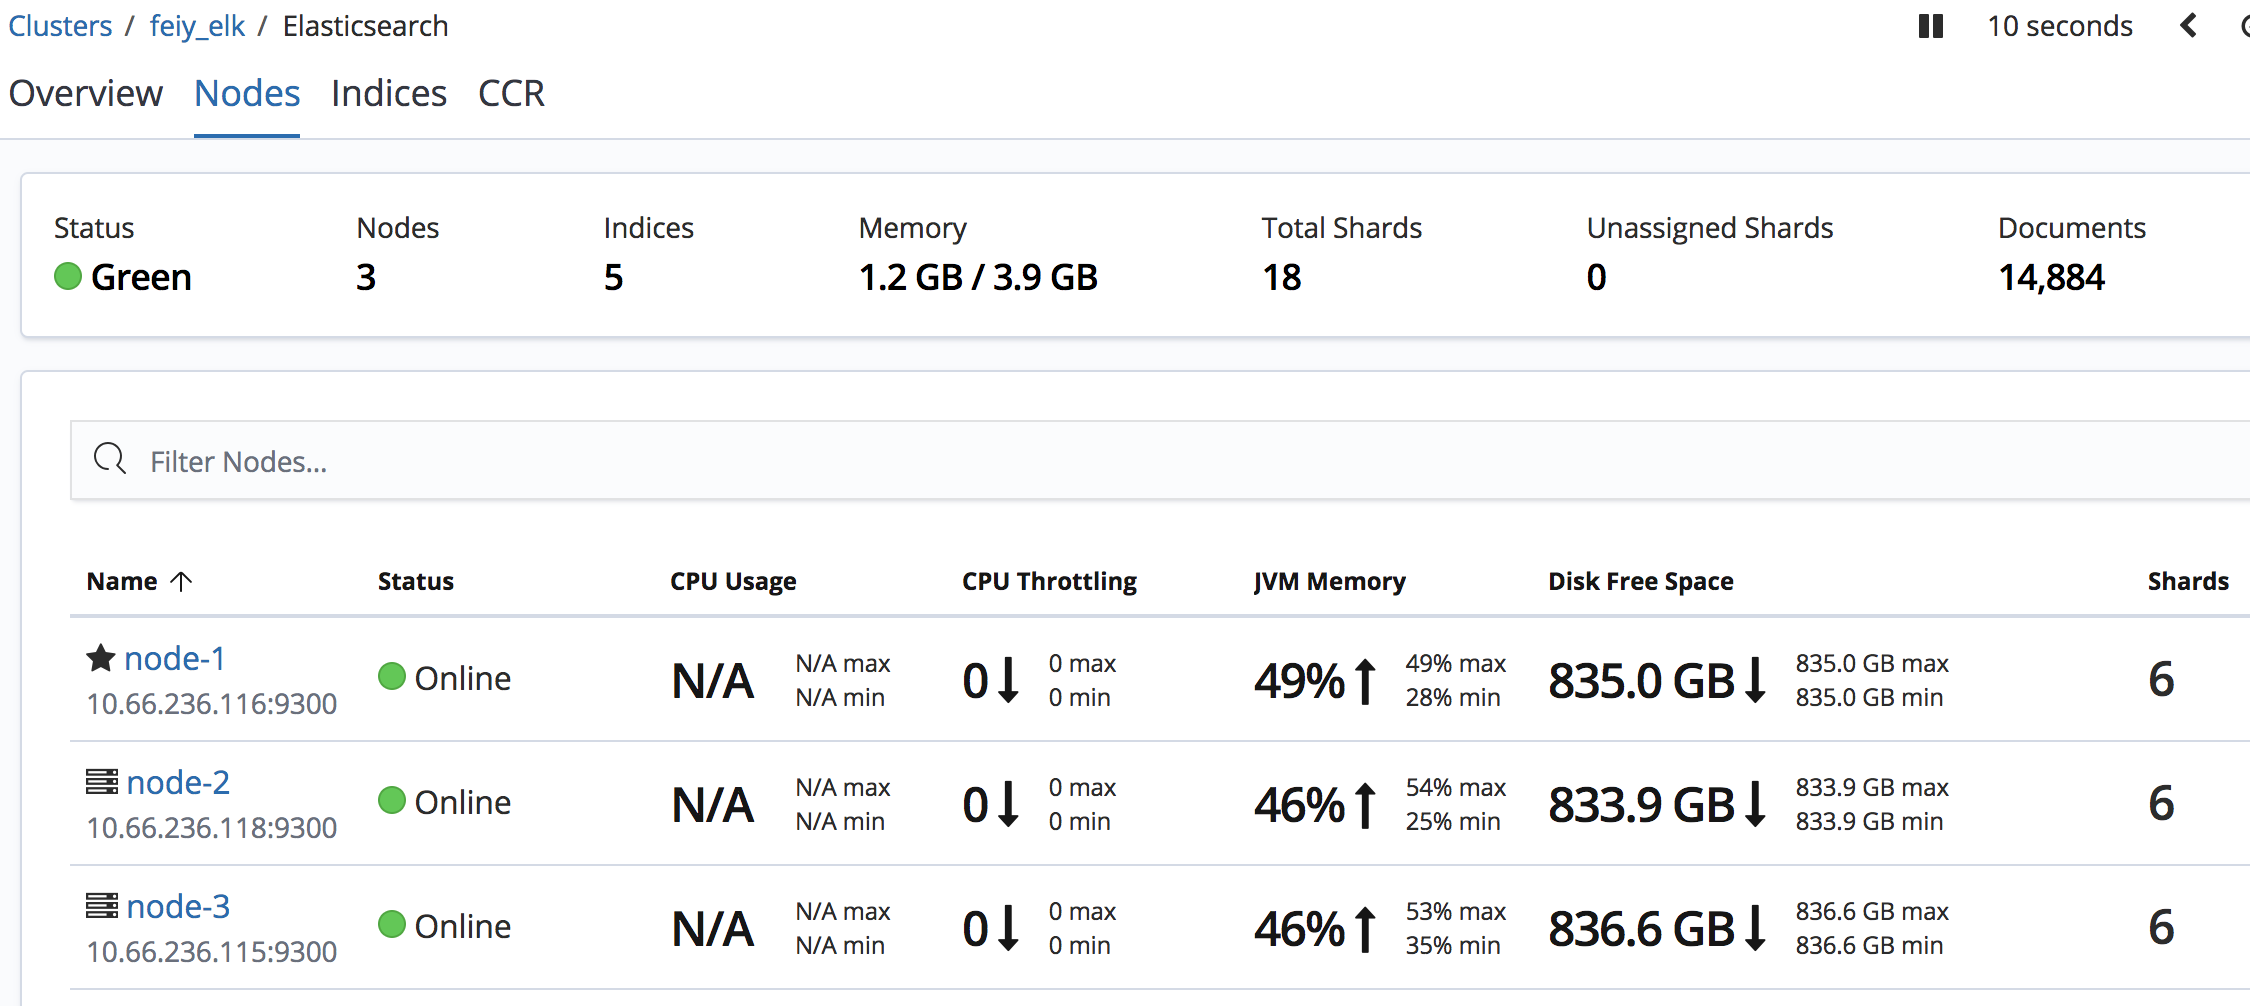
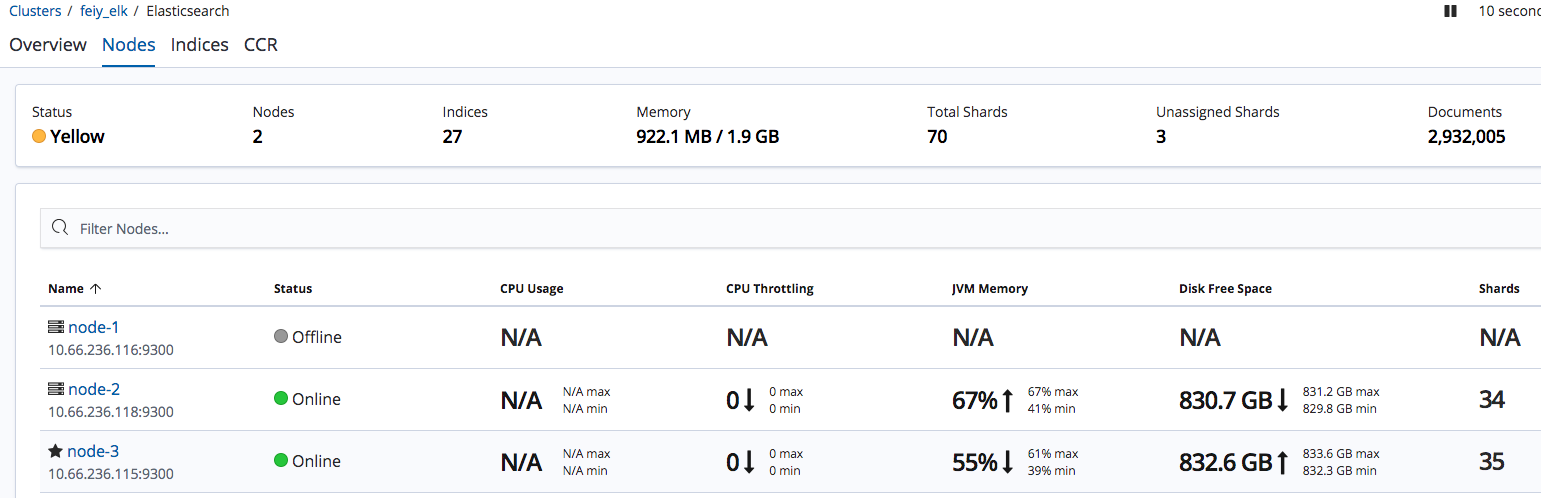
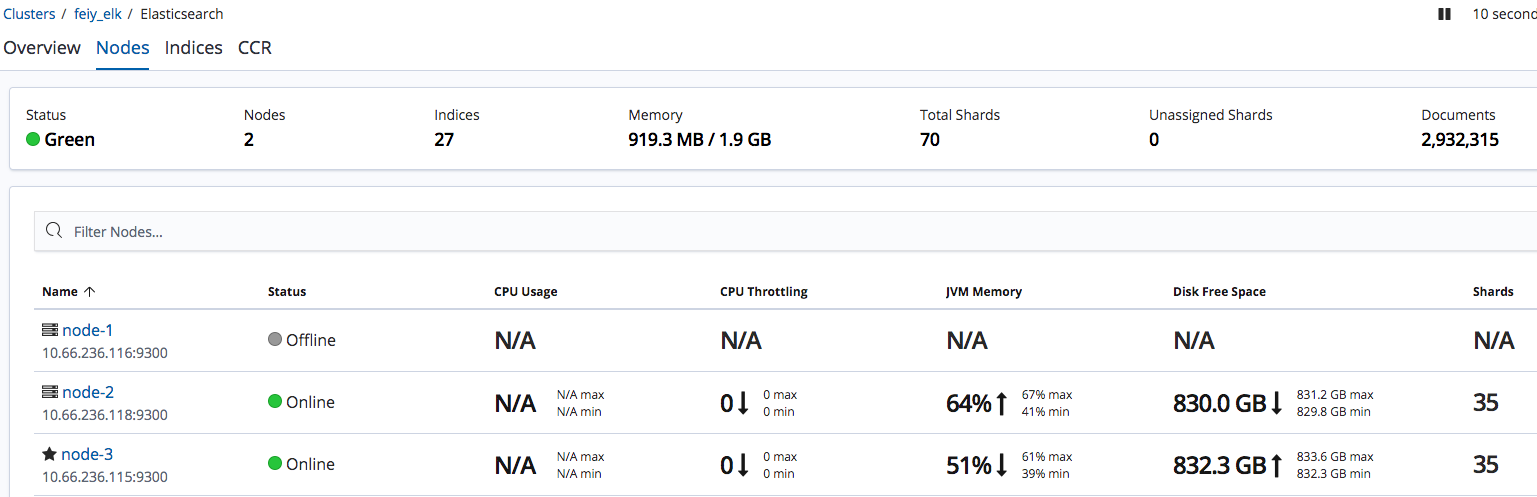
es cluster

If we use domain for es cluster node load balance, we must specify the port, because kibana will use default port is 9200. But nginx load balance port is 80 or 443. If we use wrong port, the error is kibana Request Timeout after 3000ms

自定义部分

自动删除 index

因为我是按周数来 %{+xxxx.ww} 存 index,由于我们的存储机器硬盘有限,最多能存放两个周的日志,所以需要删除两周之前的 index

1
2
3
4
5
6
7
8
# vim /opt/delete.sh
# 这个是放在容器内的脚本。
#!/bin/bash
week=$(date -d "-2 week " +%V)
year=$(date +%Y)
echo $year"-"$week
curl -XDELETE 'http://127.0.0.1:9200/*-'$year'.'$week''

宿主机上跑 cronjob

1
2
3
4
5
# vim /etc/crontab

0 03 * * 1 root /bin/docker exec [mysql 容器 ID] bash -c "cd /opt && bash delete.sh"

systemctl restart crond

内部log过大

因为默认的 log level 的 INFO, 所以 logstash 的日志特别大。导致在做 logrotate 日志切割时 disk I/O 特别的大。
解决的办法就是修改 log.level 在 /opt/logstash/config/log4j2.properties 里修改 log.level, 还有修改 /opt/logstash/config/logstash.yml 然后重启 logstash

1
2
3
4
5
6
7
8
9
10
11
12
13
14
15
16
17
# ------------ Debugging Settings --------------
#
# Options for log.level:
# * fatal
# * error
# * warn
# * info (default)
# * debug
# * trace
#日志输出的等级
# Trace:是追踪,就是程序推进一下.
# Debug:指出细粒度信息事件对调试应用程序是非常有帮助的.
# Info:消息在粗粒度级别上突出强调应用程序的运行过程.
# Warn:输出警告及warn以下级别的日志.
# Error:输出错误信息日志.
# Fatal:输出每个严重的错误事件将会导致应用程序的退出的日志.
log.level: info

修改日志保留的日期,默认是一周,可以修改 /etc/logrotate.d/logstash rotate 天数